+852 46135220

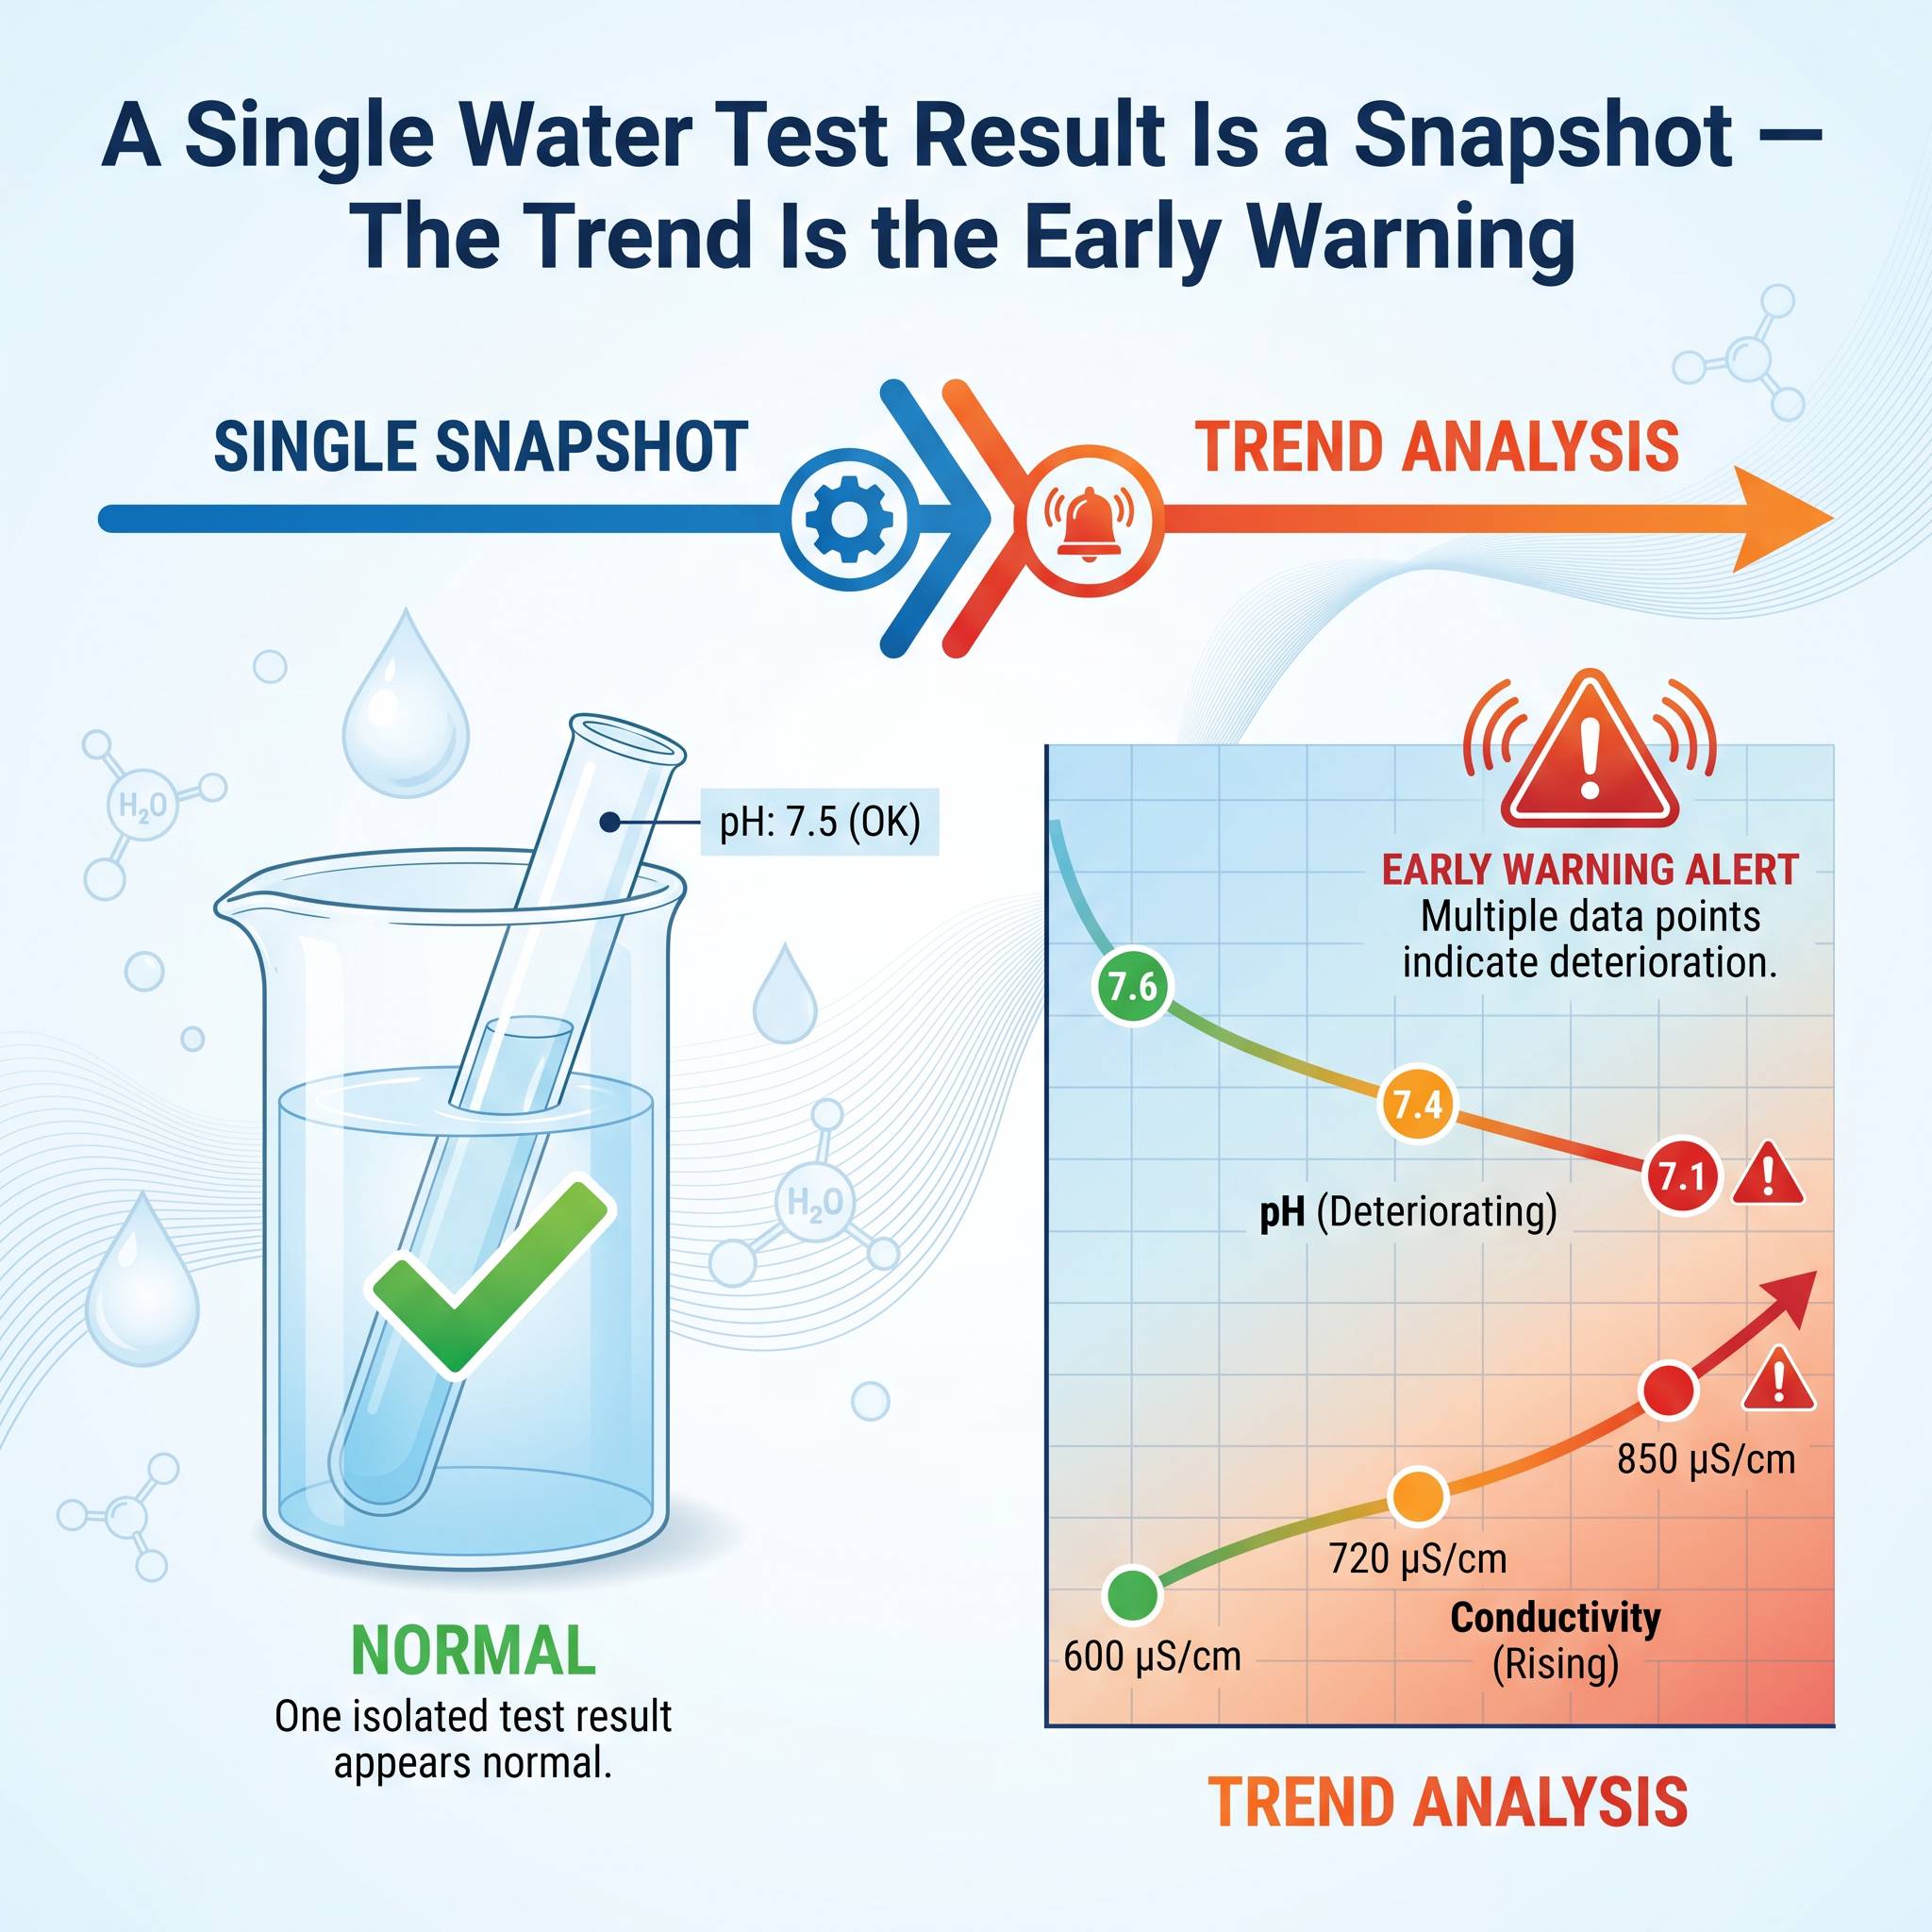
A water quality result can be within the acceptable limit and still be moving in the wrong direction. A pH value of 7.1 may look normal. A conductivity result of 850 µS/cm may still meet the internal control limit. An ammonia concentration may remain below the regulatory threshold. Based on one result alone, there may appear to be no immediate problem. But what if pH was 7.6 two weeks ago, 7.4 last week, and 7.1 today? What if conductivity has increased steadily from 600 to 850 µS/cm over the same period? What if ammonia remains compliant but has doubled over three consecutive sampling rounds? Each result may still be acceptable when viewed individually. Together, however, they tell a different story.
A single water test result shows the condition of one sample at one moment. Water quality trend analysis compares consistent results over time to identify direction, rate of change, persistence, and variability. A result may still be compliant but require investigation when it moves steadily away from the normal operating range, changes faster than expected, or becomes increasingly unstable.
That is why effective water quality monitoring should not only ask: “Is today’s result within the limit?”
It should also ask: “What direction is the system moving?”
Why One Water Quality Test Result Is Not Enough
Water quality trend analysis is the systematic comparison of comparable test results collected over time. It is used to identify gradual drift, sudden shifts, repeated spikes, cyclical behavior, or increasing variability in a water source or treatment process. Its purpose is not to replace compliance testing. Instead, it adds operational context by showing whether water quality is stable, improving, deteriorating, or moving toward a condition that may require confirmation and corrective action. Reliable trend analysis requires comparable samples, consistent analytical methods, appropriate quality control, and enough contextual information to explain changes in the data.
Every water quality result is influenced by the conditions that existed when the sample was collected and analyzed. These conditions may include:
l The sampling location
l The sampling time
l Flow rate and hydraulic conditions
l Production load
l Weather or rainfall
l Treatment chemical dosage
l Equipment operating status
l Sample preservation
l Holding time
l Analytical method
l Instrument condition
l Operator technique
Because these factors can change, one result cannot always represent the full behavior of a water system. A wastewater sample collected during a low-flow period may not represent peak production conditions. A drinking water sample collected shortly after flushing may look different from one collected after overnight stagnation. A cooling water result taken immediately after chemical dosing may not represent the condition of the system several hours later. This does not mean that single results are useless. They are essential for compliance checks, operational decisions, and immediate troubleshooting.
The problem begins when one result is treated as complete evidence of system stability. A snapshot can confirm what happened at a particular moment. It cannot, by itself, show whether that condition is temporary, recurring, or developing into a larger problem.
Single Water Test Result vs. Water Quality Trend
Question | A Single Test Result | A Water Quality Trend |
What does it show? | The condition of one sample at one moment | How comparable results change over time |
Main purpose | Immediate assessment or compliance check | Early warning and process evaluation |
Can it show direction? | No | Yes |
Can it reveal recurring behavior? | Usually not | Yes |
Can it confirm the cause of a problem? | No | No—the trend identifies a signal that still requires investigation |
Main risk | Overinterpreting one unusual result | Treating inconsistent data as a real process trend |
A single result answers, “What is happening now?” A trend adds the questions, “Is this normal, is it persistent, and where may the system be heading?”
How Water Quality Trends Provide Earlier Warning
Many water quality problems do not appear as sudden failures. They develop gradually. Membrane fouling may begin with a slow increase in differential pressure and conductivity. Biological treatment instability may first appear as a gradual change in dissolved oxygen, ammonia, sludge settling, or COD removal efficiency. Corrosion risk may increase as pH or alkalinity slowly declines. Industrial contamination may first become visible through a steady rise in conductivity, color, turbidity, or organic load. If monitoring focuses only on whether each result passes or fails, early warning signs may be missed.
Consider three simplified examples.
Example 1: Ammonia Remains Compliant but Continues to Rise
Suppose an effluent ammonia limit is 10 mg/L. The laboratory reports:
n Week 1: 2.1 mg/L
n Week 2: 3.4 mg/L
n Week 3: 5.2 mg/L
n Week 4: 7.6 mg/L
Every result is still below the limit. However, the trend may indicate that nitrification performance is weakening. Possible causes could include insufficient dissolved oxygen, reduced sludge age, temperature change, toxic loading, pH instability, or an increase in influent nitrogen load. Waiting until ammonia exceeds 10 mg/L means the process problem may already be well established.
The trend creates an opportunity to investigate before non-compliance occurs.
Example 2: Conductivity Moves Upward Across Several Samples
One conductivity result can be influenced by production conditions, dilution, chemical dosing, or recent cleaning activity. A continuous upward trend is more meaningful. It may suggest:
l Increasing dissolved salt concentration
l Reduced dilution
l Chemical overdosing
l Concentration through evaporation
l Industrial discharge entering the system
l Membrane rejection deterioration
l Cooling tower cycles increasing beyond the intended range
The conductivity value alone does not identify the cause. But the trend tells the operator that the system is changing and that further investigation may be necessary.
Example 3: pH Is Still Normal but Becoming Less Stable
A pH result of 6.9 may appear acceptable in many wastewater applications. But if the normal process range has historically been 7.3 to 7.6, repeated movement toward the lower end may indicate declining alkalinity, changing influent composition, acid carryover, or reduced process buffering capacity.
The warning is not simply that pH is low. The warning is that the process is no longer behaving as it normally does.
A Water Quality Trend Is a Signal, Not a Diagnosis
A trend can show that a system is changing, but it does not automatically identify the cause. Rising conductivity may reflect increasing dissolved salts, reduced dilution, evaporation, chemical dosing, or a change in the water source. Increasing ammonia may indicate weaker nitrification, but the underlying cause could involve dissolved oxygen, pH, alkalinity, temperature, sludge age, toxicity, or influent loading.
Trend analysis should therefore be used to trigger a structured investigation—not to replace confirmation testing, process records, related parameter data, or professional judgment.
Compliance Limits vs. Operational Warning Limits
Regulatory limits answer an important question: Is the water currently compliant?
Operational warning limits answer a different question: Is the process moving toward a condition that may become unstable or non-compliant?
These two limits should not always be identical. A wastewater plant with an ammonia discharge limit of 10 mg/L may choose to investigate when the result rises above 6 mg/L or when it increases over three consecutive tests. A cooling water system may have an acceptable conductivity range, but the operator may respond earlier if conductivity rises faster than expected. A drinking water plant may remain within the turbidity limit but still investigate a gradual increase after filtration because it could indicate filter loading, breakthrough, coagulation changes, or raw water deterioration.
The purpose of an early warning level is not to declare failure too soon. It is to create enough time for investigation and correction before failure occurs. A good monitoring program therefore distinguishes between:
Level | Meaning | Typical Response |
Normal operating range | The historical or expected range under stable conditions | Continue routine monitoring |
Warning level | The result or trend is moving away from normal operation | Review data and increase attention |
Action level | The change is significant enough to require investigation or adjustment | Confirm the result and begin corrective action |
Regulatory or critical limit | A legal, safety, product quality, or process limit has been reached | Follow the required escalation and response procedure |
These levels should be established from regulatory requirements, historical process behavior, analytical uncertainty, treatment objectives, and the consequences of delayed action. They should not be copied from another facility without confirming that the operating conditions are comparable.
Four Conditions Required for Reliable Water Quality Trend Analysis
Reliable trend analysis depends on four types of consistency.
1. Sampling Consistency
Samples should be collected from the same defined location whenever the objective is to compare results over time. The sampling procedure should also consider:
n Sampling depth
n Flushing time
n Composite versus grab sampling
n Time of day
n Production cycle
n Flow conditions
n Weather conditions
n Sample container
n Preservation
n Transport
n Holding time
For some applications, sampling at exactly the same time each day may improve comparability. In other cases, flow-proportional composite sampling may provide a more representative result. The method should match the monitoring objective.
2. Method Consistency
The same parameter can sometimes be measured by different methods, but the results may not be directly interchangeable. Changes in reagent chemistry, digestion conditions, wavelength, filtration, extraction, calibration model, or reporting basis may create artificial shifts in the data. When a laboratory changes its method, the transition should be documented. Ideally, the old and new methods should be compared over a suitable period before trend lines are combined.
3. Instrument Consistency
An instrument used for routine trend monitoring should provide more than an individual reading. It should provide repeatable results over time. Important factors include:
ü Stable calibration
ü Appropriate measurement range
ü Adequate resolution
ü Method-specific accuracy
ü Routine verification
ü Clean optical or electrochemical components
ü Consistent temperature compensation
ü Proper reagent and standard handling
ü Maintenance records
A highly advanced instrument does not automatically produce better trend data if calibration, maintenance, and operating procedures are inconsistent. For many routine parameters, repeatability and method control are just as important as maximum analytical sophistication.
4. Data Recording Consistency
Trend analysis becomes difficult when data are stored in different formats or reported without context. A useful record should include more than the final number. Depending on the application, the laboratory may also record:
l Sampling point
l Date and time
l Operator
l Instrument
l Method
l Calibration status
l Dilution factor
l Temperature
l Flow or production condition
l Weather
l Treatment dosage
l Relevant operational events
These details make it easier to distinguish real water quality changes from changes caused by sampling or analysis.
Five Common Water Quality Trend Patterns and What They May Mean
Trend monitoring does not always require advanced software or complex statistical models.
A basic graph showing results over time can already reveal useful patterns. The most common patterns include:
Gradual Drift
The result moves slowly in one direction over several measurements. This may indicate process deterioration, increasing contamination, reagent instability, sensor drift, or seasonal change.
Sudden Step Change
The result shifts sharply and remains at a new level. Possible causes include a process modification, equipment failure, new raw material, industrial discharge, method change, or instrument calibration issue.
Repeated Spikes
The system usually appears stable but shows recurring high or low results. This may be linked to production cycles, cleaning activities, batch discharges, rainfall, shift patterns, or sampling timing.
Increasing Variability
The average result may remain acceptable, but the measurements become less consistent. Higher variability can be an early sign that the process is becoming unstable.
Cyclical Behavior
Results rise and fall in a repeated pattern. This can reflect daily production cycles, seasonal temperature changes, chemical dosing intervals, regeneration cycles, or equipment operation. The value of the graph is not only in showing the numbers. It helps the laboratory and operational team ask better questions.
Trend Pattern | What It May Indicate | First Questions to Ask |
Gradual drift | Progressive process, source-water, instrument, or reagent change | Is the shift persistent, and do QC results remain stable? |
Sudden step change | Equipment failure, method change, new discharge, or process modification | What operational or analytical event occurred at the same time? |
Repeated spikes | Batch discharge, cleaning activity, intermittent dosing, or sampling-time effect | Do the spikes occur at the same time or production stage? |
Increasing variability | Process instability or inconsistent sampling and analysis | Has the average remained stable while the spread has increased? |
Cyclical behavior | Daily, weekly, seasonal, regeneration, or production cycles | Does the pattern align with time, flow, temperature, or operations? |
These patterns indicate where to investigate; they do not confirm the cause by themselves.
Which Water Quality Parameters Should Be Compared Together?
A parameter trend becomes more useful when it is compared with related data. For example:
Primary Trend | Related Data to Compare | Possible Operational Question |
Effluent ammonia | Dissolved oxygen, pH, alkalinity, temperature, sludge age | Is nitrification becoming less stable? |
Effluent COD | Influent COD, flow, suspended solids, treatment stage data | Has loading increased or removal efficiency declined? |
Conductivity | Flow, evaporation, chemical dosing, source water | Is salt concentration increasing, and why? |
Filtered-water turbidity | Raw-water turbidity, coagulant dose, filter run time | Is filtration performance deteriorating? |
Residual chlorine | Flow, contact time, temperature, demand | Is disinfectant control becoming less reliable? |
Phosphate | Influent load, chemical dosage, pH, solids removal | Is nutrient removal or precipitation performance changing? |
A single trend may show that something is changing. Several related trends may help explain why. For example, rising effluent ammonia together with falling dissolved oxygen may suggest insufficient aeration. Rising conductivity together with reduced water flow may indicate concentration rather than a new pollutant source. Increasing turbidity after filtration may be interpreted differently depending on raw water turbidity and coagulant dosage.
This is where water quality data becomes more than laboratory reporting. It becomes part of process diagnosis.
Four Questions to Ask When a Trend Begins to Change
When a parameter begins to move away from its normal pattern, the response should be systematic.
1. Is the Change Analytically Real?
Before changing the treatment process, confirm the result. This may involve:
n Repeating the test
n Checking calibration
n Running a control standard
n Reviewing reagent expiry and storage
n Examining blanks
n Confirming dilution
n Inspecting the sample
n Comparing with a second method or instrument where appropriate
The purpose is not to dismiss unusual results. It is to avoid operational decisions based on analytical error.
2. Has the Sampling Condition Changed?
Confirm whether the sample was collected at the usual point and under comparable conditions. A result may change because:
u The sample was taken during peak production
u Rainfall diluted the influent
u A tank had recently been cleaned
u The line had not been flushed
u The sample came from another depth or location
u The holding time was longer than usual
Sampling context is often essential to interpretation.
3. Did the Process or Water Source Change?
Review operational events such as:
l Chemical dosing changes
l Flow increase
l New raw materials
l Equipment shutdown
l Membrane cleaning
l Filter backwashing
l Aeration changes
l Sludge wasting
l Industrial discharge
l Source water change
l Temperature shift
A trend often becomes understandable when laboratory data is aligned with operational records.
4. What Decision Should the Trend Trigger?
A monitoring program should define what happens when a trend becomes concerning. Possible actions include:
n Increase sampling frequency
n Add a confirmation test
n Inspect treatment equipment
n Review dosing
n Check influent source
n Compare upstream and downstream samples
n Investigate related parameters
n Notify operations
n Start corrective action
n Escalate to management or compliance personnel
Without a defined response, trend monitoring may produce more charts but not better decisions.
Water Quality Trend Monitoring in Wastewater, Drinking Water, and Industrial Water
Wastewater Treatment
Useful trends may include:
l Influent and effluent COD
l Ammonia
l Nitrate
l Phosphate
l Dissolved oxygen
l pH
l Suspended solids
l Sludge volume index
l Turbidity
l Flow
These trends can help identify changes in loading, biological treatment performance, settling, aeration, nutrient removal, and chemical dosing.
Drinking Water Treatment
Useful trends may include:
l Raw water turbidity
l Filtered water turbidity
l pH
l Conductivity
l Color
l Residual disinfectant
l Temperature
l Alkalinity
l Organic indicators
Trend changes may provide early warning of raw water deterioration, treatment inefficiency, filter breakthrough, disinfection instability, or distribution system problems.
Industrial Water
Useful trends may include:
l Conductivity
l pH
l Hardness
l Alkalinity
l Silica
l Chloride
l Dissolved oxygen
l Turbidity
l Corrosion indicators
l Microbiological parameters
These trends can support boiler water, cooling water, process water, reverse osmosis, and reuse systems.
Environmental Monitoring
Environmental data often shows natural seasonal and weather-related variation. Trend interpretation may therefore require comparison with:
l Rainfall
l River flow
l Temperature
l Land use
l Discharge activity
l Sampling season
Upstream and downstream locations
A change is not always evidence of pollution, but consistent monitoring makes unusual deviations easier to identify.
Avoiding Two Common Mistakes
Mistake 1: Reacting to Every Small Change
Not every increase or decrease requires immediate process adjustment. Normal analytical variation, sampling variation, and process fluctuation must be considered. Overreacting can create unnecessary chemical use, unstable treatment, and repeated process changes that make the system harder to understand.
The goal is not to eliminate all variation. It is to recognize meaningful variation.
Mistake 2: Waiting Until the Limit Is Exceeded
The opposite mistake is equally serious. If action only begins after regulatory failure, the monitoring program is being used as a compliance alarm rather than a process management tool. By that stage, corrective action may be more difficult, more expensive, and less effective.
Good monitoring balances these two risks:
n Do not overreact to random variation.
n Do not ignore a consistent movement toward failure.
How to Build a Practical Water Quality Trend Monitoring Program
A practical trend-monitoring system can begin with a few simple steps.
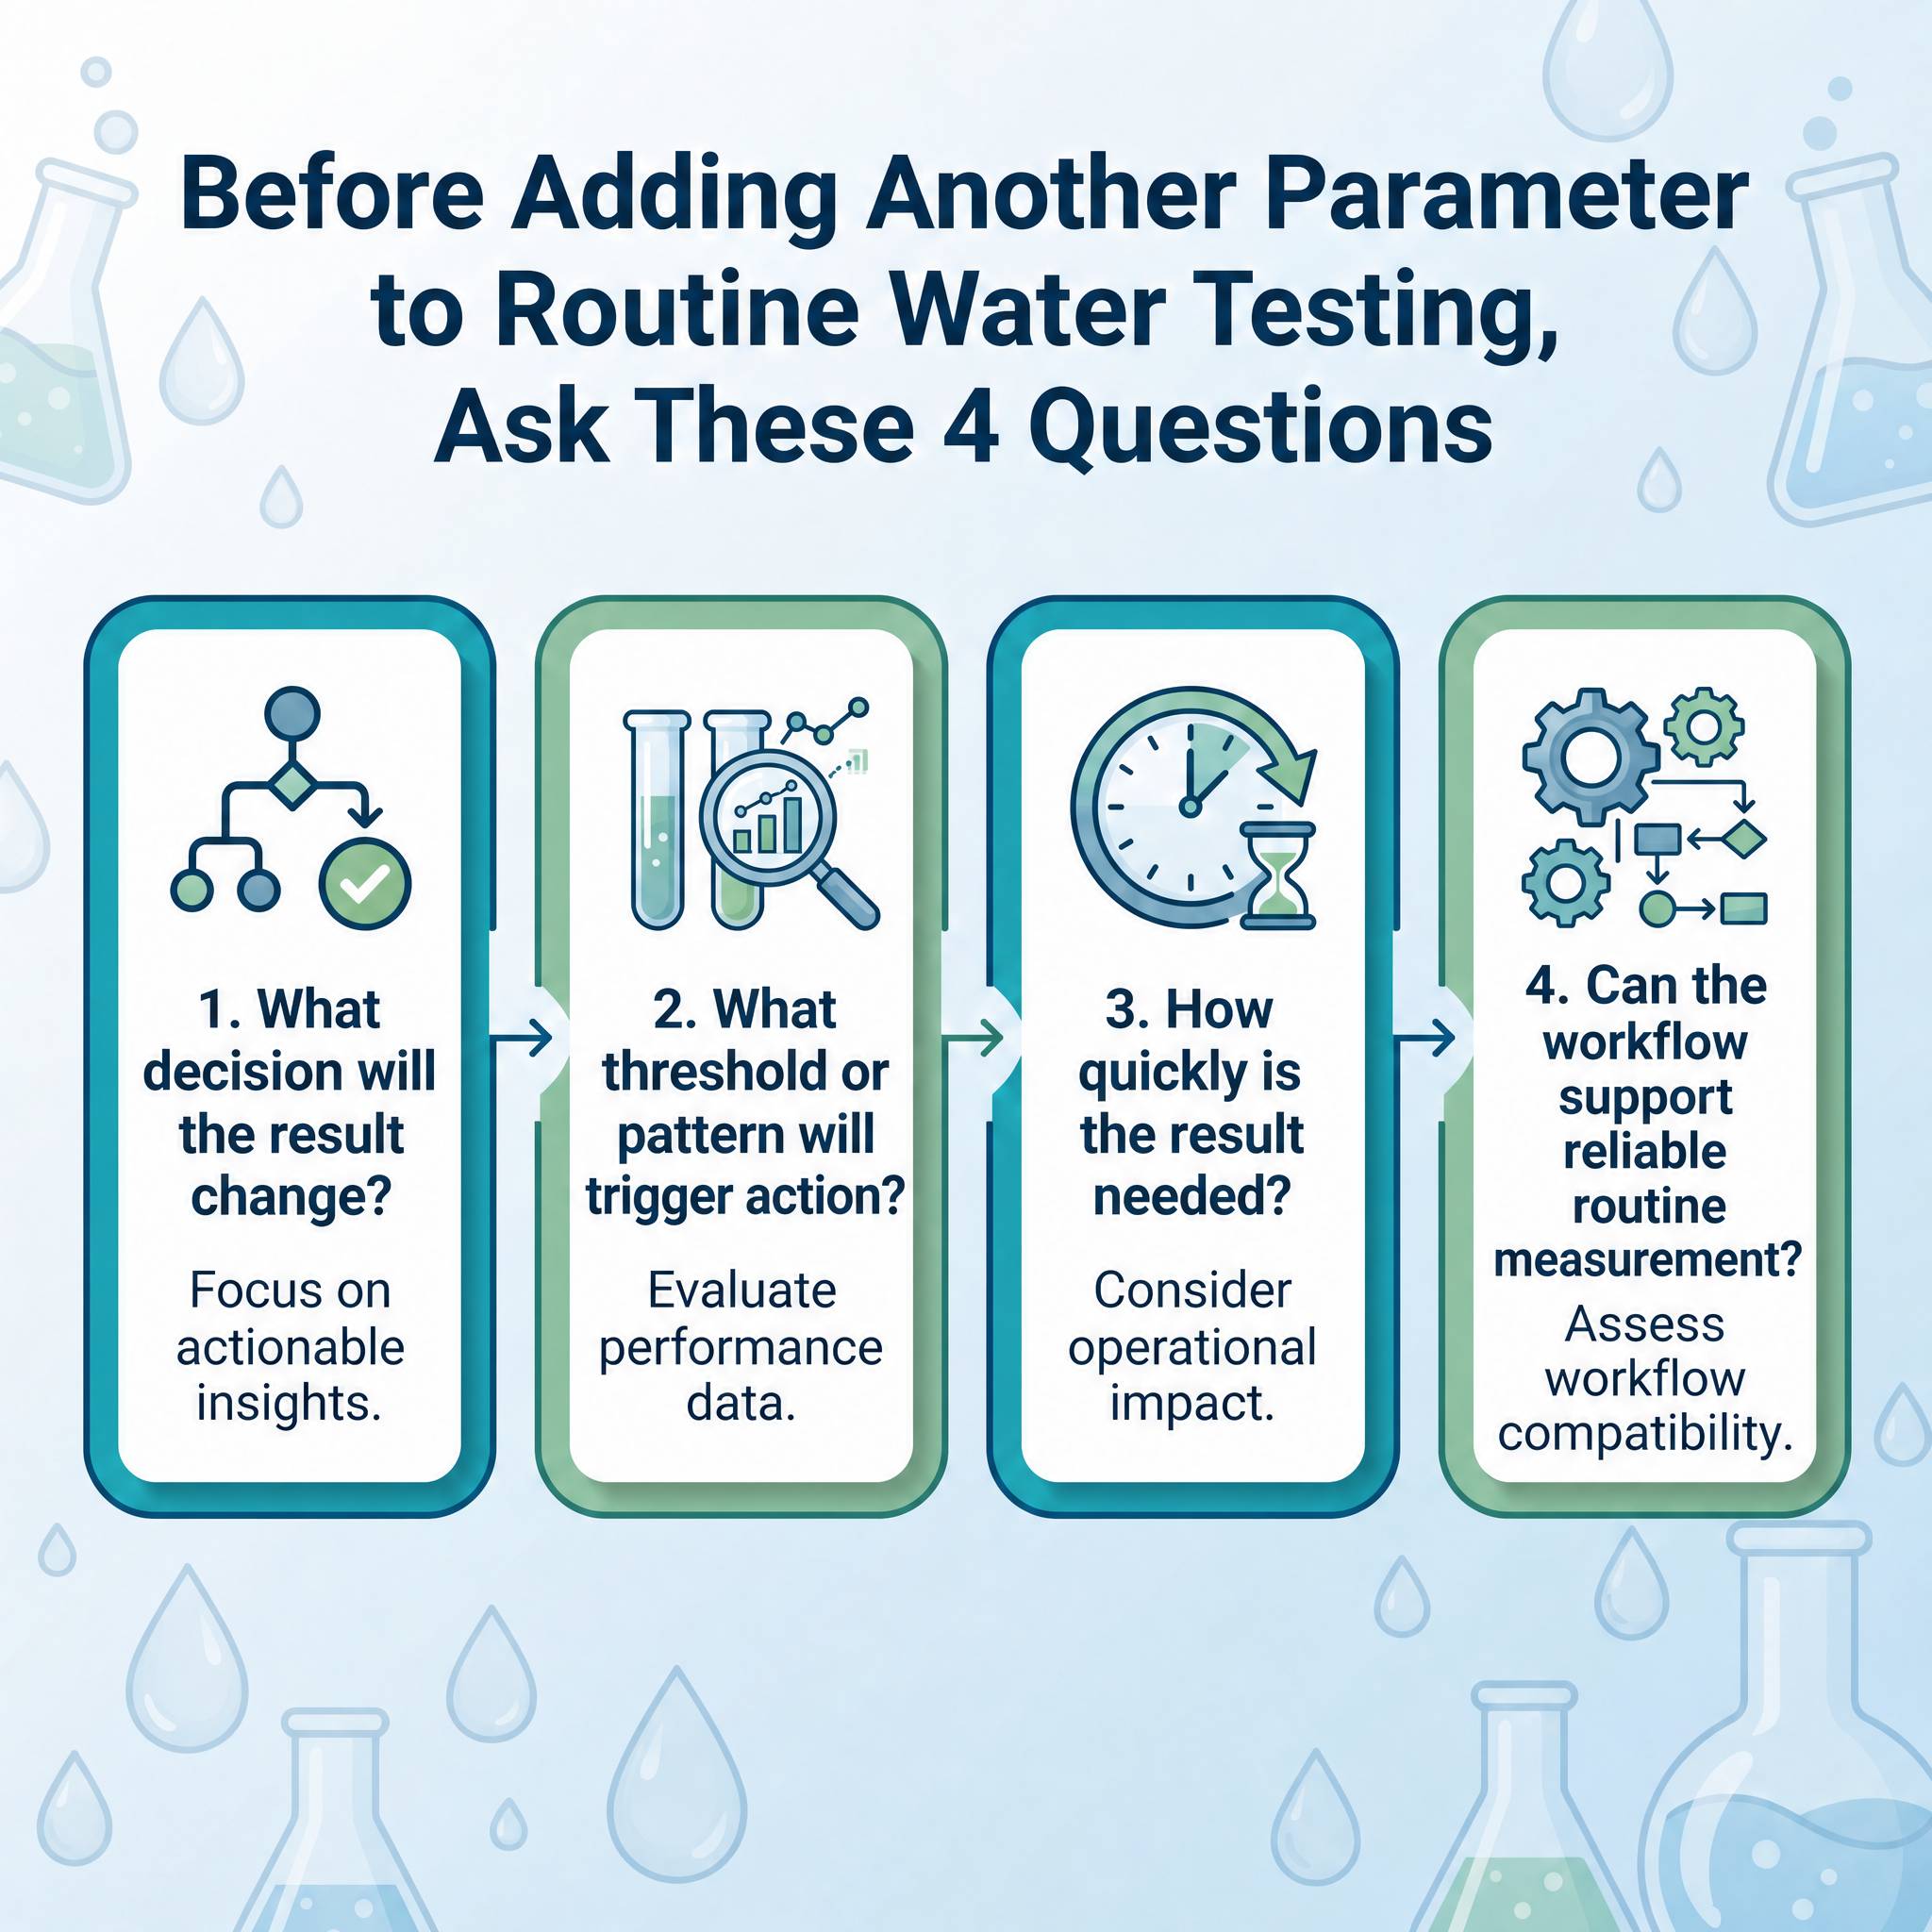
Step 1: Select Parameters with Operational Value
Do not trend every available parameter simply because it can be measured. Focus first on parameters that reflect:
l Pollution load
l Treatment performance
l Equipment condition
l Regulatory risk
l Product quality
l Corrosion or scaling
l Biological stability
l Chemical dosing
Step 2: Establish the Normal Operating Pattern
Historical data can help define the usual range, average, variability, seasonal pattern, and expected response to process changes. A regulatory limit alone does not define normal operation.
Step 3: Define Warning Conditions
Warning conditions may include:
l A result approaching an action limit
l Three consecutive increases
l A rapid rate of change
l Unusual variability
l A repeated spike
l A difference between related sampling points
l A result outside the historical operating range
Step 4: Confirm Data Quality
Before interpreting the trend, verify sampling, calibration, methods, reagents, units, and data entry.
Step 5: Connect the Warning to an Action
Define who reviews the trend, who is notified, what confirmation is required, and what operational checks should follow.
Step 6: Review Whether the Warning Was Useful
After an investigation, determine whether the trend correctly identified a developing issue or whether the warning condition should be adjusted. Trend monitoring should improve through experience.
Conclusion
A single water test result answers an important question: What was measured in this sample at this time?
A trend answers a broader and often more valuable question: How is the water system changing?
The first question supports immediate assessment and compliance. The second supports prevention.
Water quality trend analysis turns routine measurements into an early-warning system. Its purpose is not to react to every small fluctuation or to predict every failure. Its purpose is to identify persistent, comparable, and operationally meaningful change early enough for the result to be confirmed and the process to be investigated.
The most useful monitoring programs therefore evaluate more than whether a result passes or fails. They consider direction, rate of change, variability, related parameters, data quality, and the action that should follow.
A single result is a snapshot. The trend shows where the system may be heading.