+852 46135220

A water quality analyzer displays a number. The reading is stable. You repeat the measurement and obtain almost the same result. Does that mean the result is correct? Not necessarily.
In routine water testing, one of the most important distinctions is the difference between getting a result and getting a result that can be trusted. A measurement may look perfectly reasonable on the screen and still be affected by calibration problems, sample handling, unsuitable methods, reagent issues, matrix interference, or other analytical factors.
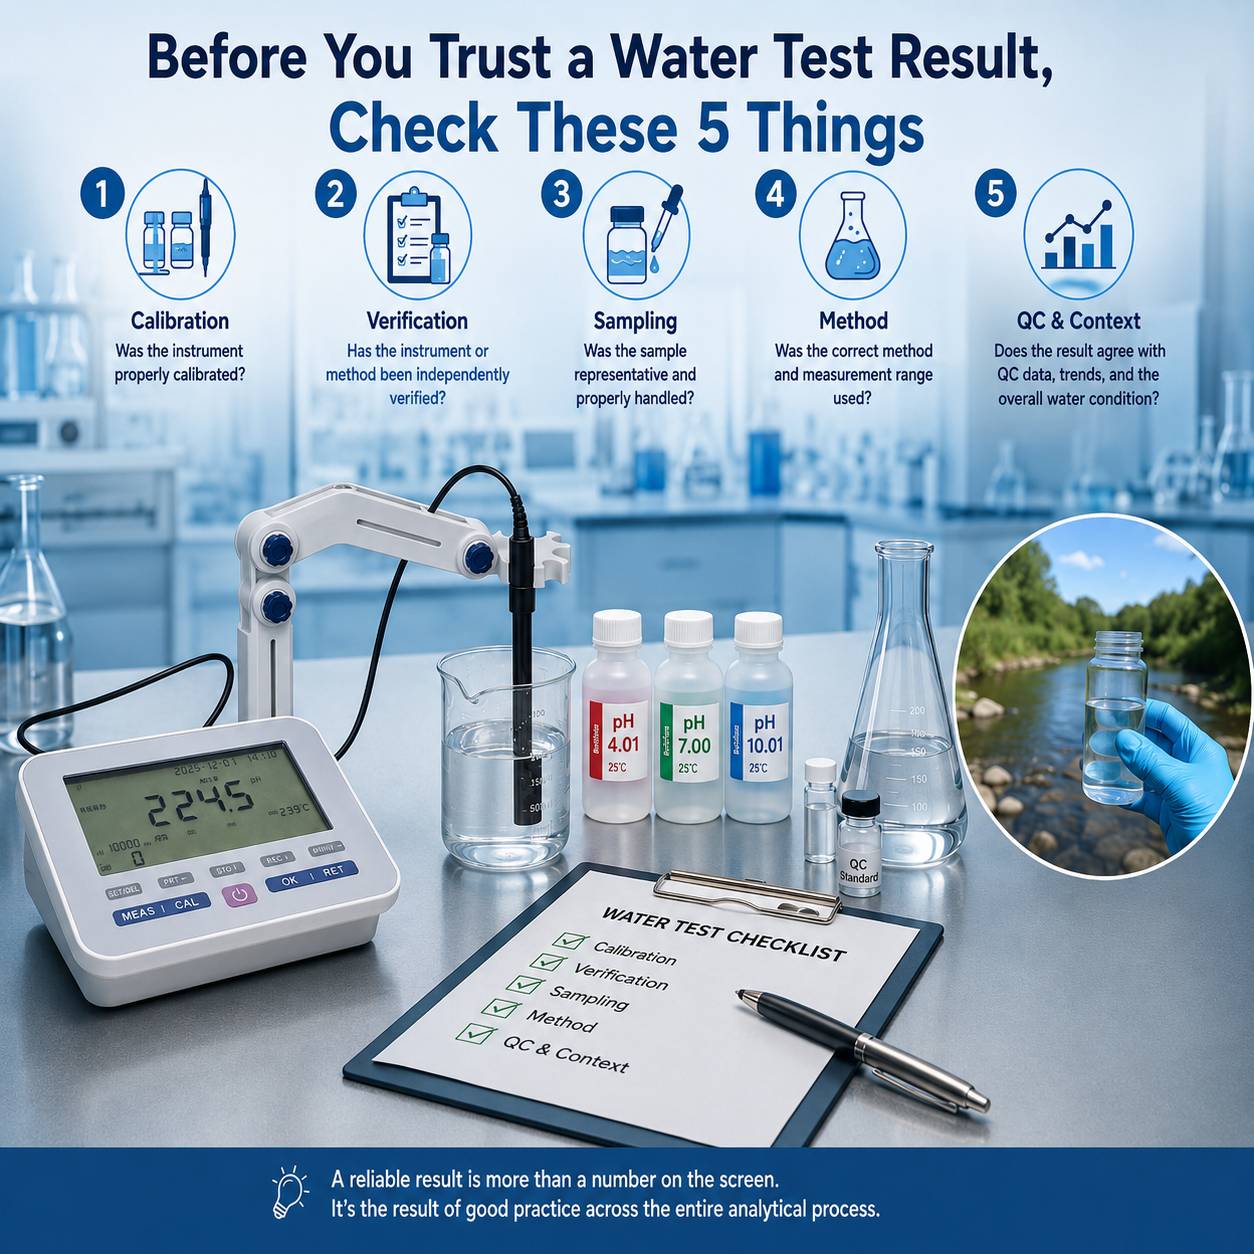
This is why laboratories should not judge data quality from the displayed number alone. Before accepting a water test result, it is useful to check at least five things.
What makes a water test result reliable?
A reliable water test result depends on more than a stable instrument reading. Laboratories should consider instrument calibration, independent verification, representative sampling, method suitability, quality-control performance, and whether the result is consistent with the expected water condition. A repeatable result can still be inaccurate if the same systematic error affects every measurement.
1. Was the Instrument Properly Calibrated?
Calibration is one of the first foundations of reliable measurement. However, calibration alone does not prove that every sample result is accurate. Calibration establishes the relationship between the measurement system and known reference values, while the quality of the final result still depends on the sample, method, reagents, instrument condition, and analytical procedure.
Whether the instrument is a pH meter, conductivity meter, dissolved oxygen meter, photometer, or spectrophotometer, the measurement system needs an appropriate reference before unknown samples can be evaluated confidently. But calibration is more than simply pressing the “calibrate” button. Questions worth asking include:
l Were appropriate calibration standards used?
l Were the standards still within their usable condition?
l Was the calibration range suitable for the expected sample concentration?
l Were electrodes, cuvettes, optical surfaces, and other measurement components clean and in good condition?
l Was calibration performed according to the measurement method and instrument requirements?
For example, imagine a laboratory measuring phosphate in the range of 1–5 mg/L. If the analytical system has not been properly calibrated or checked within the relevant range, a stable displayed value does not automatically mean that the measurement is reliable. The same principle applies to electrochemical measurements. A pH meter may display 7.214 with three decimal places, but the number of digits on the screen does not prove that the actual measurement accuracy is equally high.
Resolution tells us how finely an instrument displays a value. Calibration helps establish whether that value corresponds correctly to a known reference.
2. Has the Water Testing Instrument or Method Been Independently Verified?
Calibration and verification are related, but they are not the same thing. After calibration, it can be useful to check the instrument or analytical procedure against a known reference that is not simply treated as part of the calibration itself. The practical question is: Can the measurement system correctly recover a value that we already know?
For example, after calibrating a pH meter, a laboratory may measure another suitable buffer solution to see whether the instrument gives an acceptable result. For photometric analysis, a laboratory may use an appropriate reference or quality-control material to confirm that the overall analytical procedure is performing as expected. This additional check matters because successful calibration does not guarantee that every later measurement will automatically be correct.
Problems can still develop from:
u electrode deterioration,
u contamination,
u reagent deterioration,
u optical contamination,
u incorrect sample preparation,
u instrument drift,
u or operator handling.
A useful way to think about the relationship is: Calibration establishes the measurement reference. Verification asks whether the system is still producing acceptable results.
In routine water quality analysis, these checks are often part of a broader quality assurance and quality control (QA/QC) approach. Calibration prepares the measurement system, verification confirms that it performs acceptably, and QC checks help detect problems that may develop during routine sample analysis..
3. Was the Sample Representative and Properly Handled?
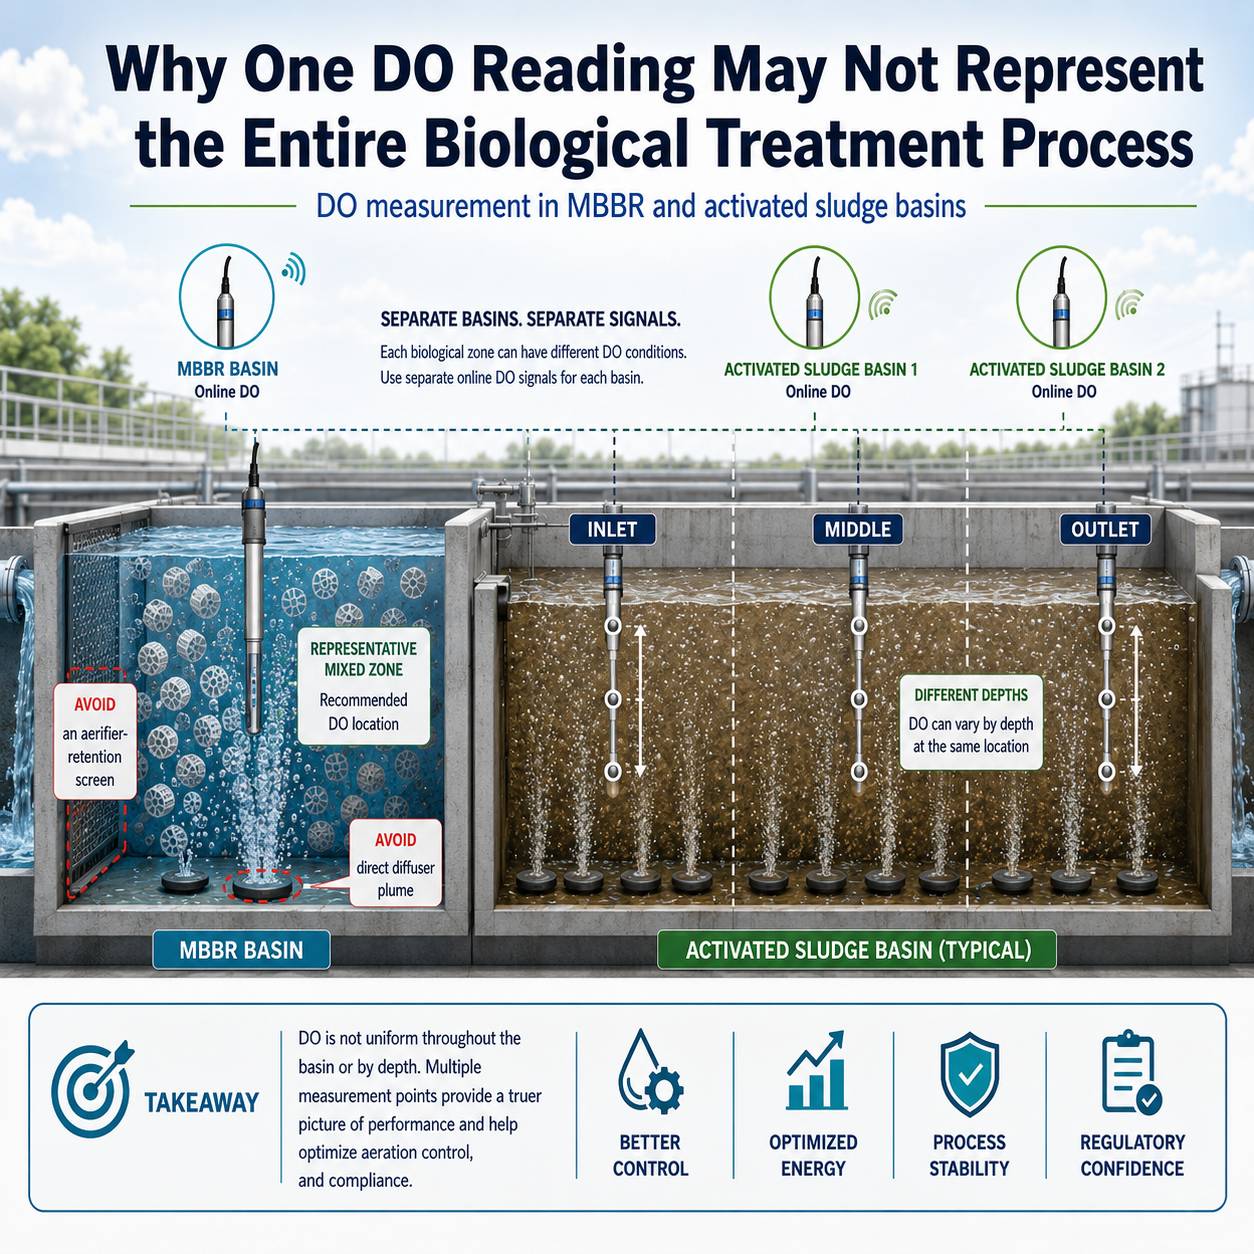
Even a perfectly functioning instrument cannot correct a poor sample. This is one of the most important realities in water analysis. The analytical result represents the sample presented to the instrument, not necessarily the entire water body, process stream, tank, basin, or pipeline from which the sample originated. A representative water sample is one that reasonably reflects the water condition or process condition that the laboratory is trying to evaluate. Poor sampling can therefore produce a misleading water quality result even when the analytical instrument and method are working correctly.
Consider a wastewater treatment basin. Water quality may vary with:
n sampling location,
n depth,
n flow condition,
n aeration,
n solids distribution,
n process cycle,
n and sampling time.
A dissolved oxygen reading taken near an aerator may therefore be very different from a reading taken in another part of the same biological basin. Both measurements could be technically correct. The real question is whether either measurement represents the condition that the operator wants to understand.
Sample handling after collection also matters. Depending on the parameter, changes may occur because of:
u temperature changes,
u biological activity,
u gas exchange,
u sedimentation,
u precipitation,
u volatilization,
u exposure to light,
u contamination,
u or excessive holding time.
For some measurements, the time between sampling and analysis can therefore be just as important as the analyzer itself. Parameters such as dissolved oxygen, pH, temperature, residual chlorine, and other unstable characteristics may change quickly after a sample is collected. In these cases, field or on-site measurement may sometimes provide more representative information than transporting the sample to a laboratory for later analysis. Other parameters can be analyzed reliably in the laboratory when appropriate sampling, preservation, storage, and holding-time procedures are followed.
This leads to an important principle: A high-quality instrument cannot turn an unrepresentative or poorly handled sample into reliable process information.
When an unexpected result appears, the instrument should therefore not automatically be the first thing blamed. The sample itself deserves equal attention.
4. Was the Correct Water Testing Method and Measurement Range Used?
A method can work very well for one water sample and perform poorly for another. Water is not a simple analytical matrix. Drinking water, surface water, seawater, industrial wastewater, municipal wastewater, and process water can contain very different concentrations of salts, suspended solids, organic compounds, oxidizing or reducing substances, color, and other interfering components. These differences can influence measurement.
For this reason, laboratories should ask several questions before trusting a result:
l Is the analytical method suitable for this type of water?
l Is the expected concentration within the method's measurement range?
l Could the sample contain substances that interfere with the measurement?
l Does the sample require filtration, digestion, dilution, preservation, or other preparation?
l Was the correct reagent and procedure used?
Measurement Range Matters
Suppose an analyzer is designed to measure a parameter from 0 to 10 mg/L. A sample whose actual concentration is far above that range may require dilution before analysis. Simply obtaining a displayed number does not mean that the sample was measured under appropriate analytical conditions. Depending on the method and instrument, an out-of-range or near-limit result may not always appear obviously “wrong” on the display. This is why laboratories should confirm that the expected sample concentration falls within the validated or recommended measurement range before accepting the result.
The same problem can occur near the lower end of a measurement range. A value may be displayed, but the uncertainty at very low concentrations may be much more important than the number of decimal places suggests.
Matrix Interference Matters
Consider colorimetric water analysis. The instrument measures an optical response after the sample reacts with specific reagents. But real samples may already contain:
l strong background color,
l turbidity,
l suspended particles,
l other reactive chemicals,
l or high concentrations of dissolved substances.
These factors may affect the optical response. The instrument cannot automatically know whether all measured absorbance comes from the target analyte. Matrix interference occurs when substances or physical characteristics in the sample influence the analytical response independently of the target parameter. Depending on the method, this may include sample color, turbidity, salinity, suspended solids, oxidizing or reducing substances, or other chemical species. That is why method suitability is part of result reliability. A good analyzer and a good method need to work together.
5. Does the Result Agree With QC Data, Historical Trends, and the Overall Water Condition?
One isolated result should rarely be interpreted without context. Suppose a wastewater treatment plant normally records ammonia concentrations around: 2–4 mg/L and today's result suddenly shows: 18 mg/L
There are at least two possibilities. The process may genuinely have changed. Or something may have gone wrong during sampling or analysis.
Repeating the test can provide useful information, but repetition alone does not answer the whole question. Imagine three repeat measurements:
l 18.1 mg/L
l 18.0 mg/L
l 18.2 mg/L
The repeatability looks excellent. But this only shows that the measurement can be reproduced. It does not automatically prove that the result is correct. If an incorrect reagent preparation, systematic calibration error, sample contamination, or matrix interference affects every measurement in the same way, repeated testing may continue to produce very similar—but inaccurate—results.
This is where quality-control checks and contextual information become valuable. Laboratories may compare the result with:
l blanks,
l control samples,
l duplicate measurements,
l reference materials,
l previous results,
l process operating conditions,
l related water-quality parameters,
l and expected concentration ranges.
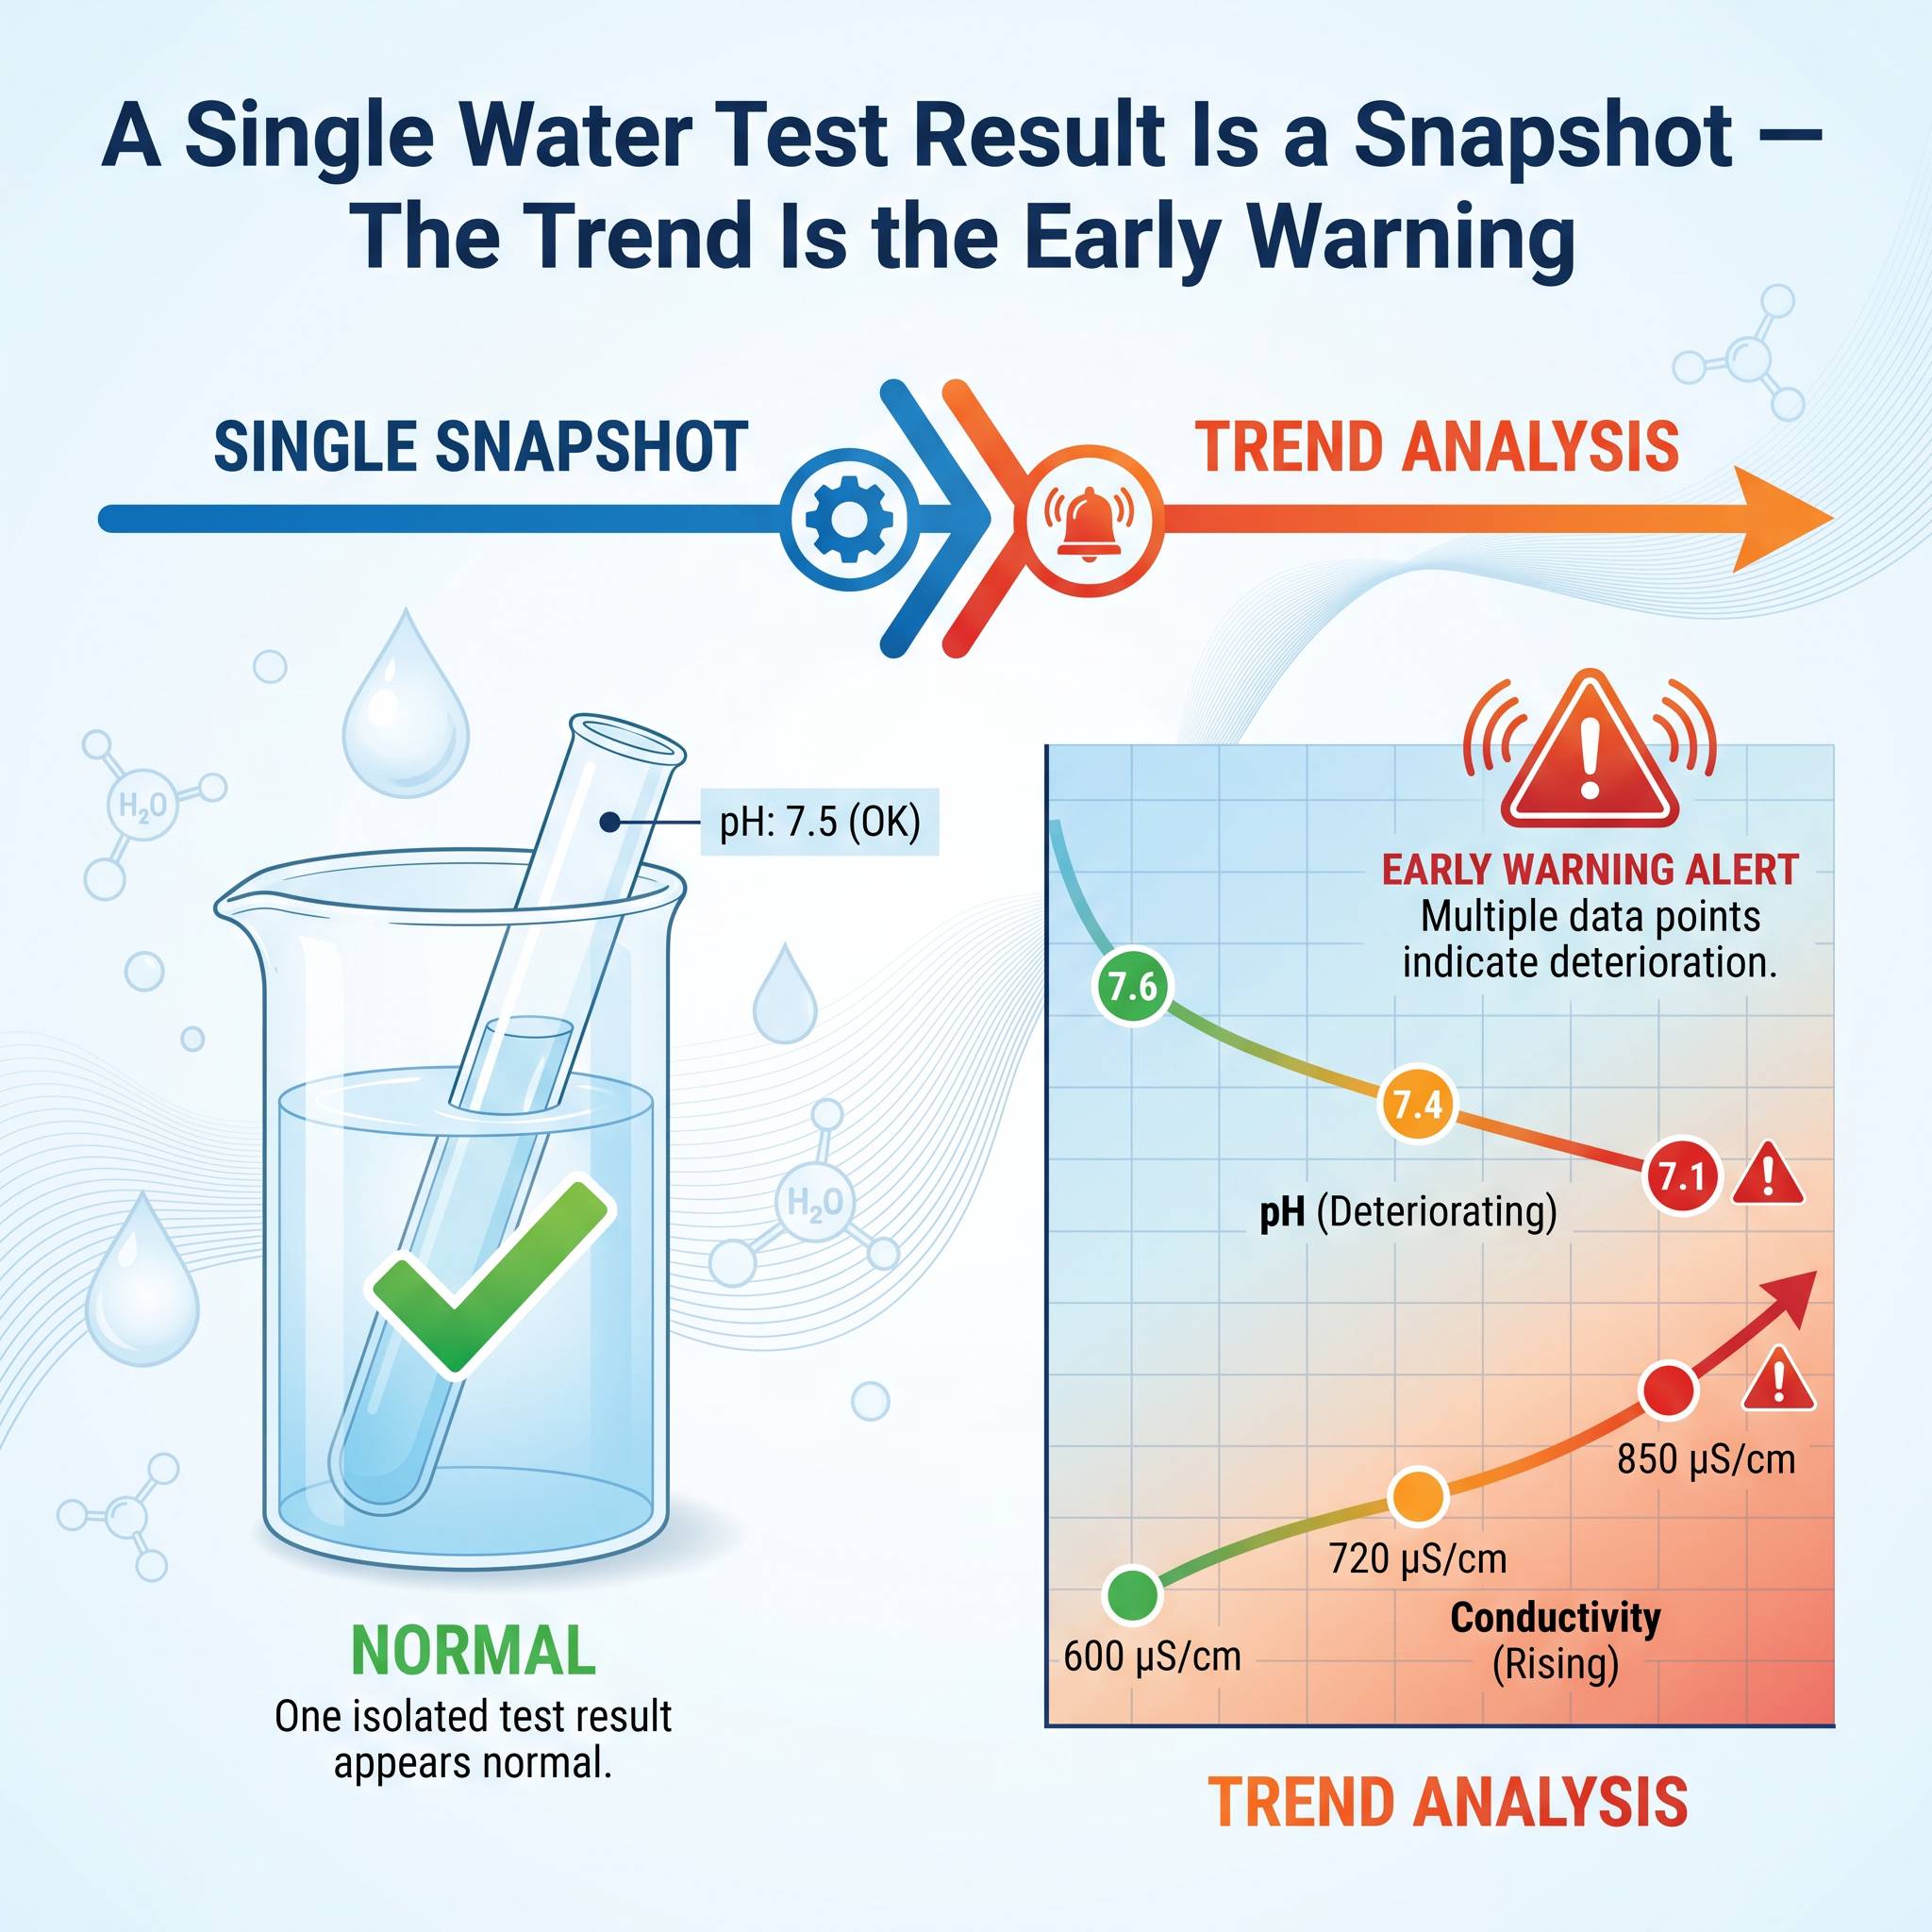
Historical trends can be especially useful. A single measurement tells you what the analytical system reported at one point in time. A trend helps show whether that value fits a larger pattern. For example, a sudden increase in conductivity may become more meaningful if it occurs together with changes in TDS, chloride, or industrial process conditions. Similarly, an unusual COD result may deserve further investigation if influent characteristics, treatment performance, or other related measurements have also changed.
The goal is not to reject every unexpected result. Unexpected results are sometimes the most valuable results in the laboratory. The goal is to determine whether the change reflects the water or the measurement process.
An Unexpected Result Is Not Automatically a Wrong Result
Laboratories should be careful not to reject a result simply because it is different from previous values. A genuine process upset, contamination event, treatment failure, raw-water change, industrial discharge, or operational adjustment may produce a real and important change in water quality.
The purpose of QC and result verification is therefore not to make unusual data disappear. It is to determine whether the unusual result is supported by the analytical evidence. Good quality control helps distinguish an analytical problem from a real change in the water.
Repeatable Does Not Always Mean Correct
In water analysis, precision and accuracy describe different aspects of measurement quality.
l Precision describes how closely repeated measurements agree with each other.
l Accuracy describes how closely a measurement agrees with an accepted or reference value.
l Repeatability is one aspect of precision under similar measurement conditions.
A result can therefore be highly repeatable and precise while still being inaccurate because of systematic bias. This distinction deserves special attention because it is easy to misunderstand.
Consider two measurement situations.
Situation A
Three measurements:
l 5.01 mg/L
l 5.84 mg/L
l 4.62 mg/L
The results vary considerably. There is clearly a repeatability problem that should be investigated.
Situation B
Three measurements:
l 5.81 mg/L
l 5.82 mg/L
l 5.81 mg/L
These measurements look much better. But suppose these measurements were performed on a QC or reference sample with an assigned value of approximately: 5.00 mg/L. Situation B is highly repeatable, but the results show a clear systematic bias relative to the assigned reference value.
This can happen when all measurements are influenced by the same source of bias. A systematic error is a consistent measurement bias that shifts results in the same direction. Because the error is repeated consistently, repeated measurements may look very precise even though they remain inaccurate.
Examples might include:
u incorrect calibration,
u deteriorated reagents,
u incorrect blank correction,
u systematic sample preparation error,
u matrix interference,
u or an unsuitable analytical method.
Therefore: Repeatability tells us whether measurements agree with each other. It does not, by itself, tell us whether they agree with the true value.
This is one reason why calibration, verification, QC checks, and proper sampling should be viewed as complementary parts of the measurement process rather than separate administrative tasks.
A Practical Result-Checking Sequence
When a water quality result looks unusual, laboratories can use a simple troubleshooting sequence.
Step 1: Check the Result
Was the reading stable?
Was the value correctly recorded?
Was the correct unit used?
Step 2: Check the Sample
Was the correct sample measured?
Was it properly mixed, preserved, filtered, diluted, or digested where required?
Could contamination or sample deterioration have occurred?
Step 3: Check the Method
Was the correct method selected?
Was the concentration inside the appropriate measurement range?
Could matrix interference be present?
Step 4: Check Calibration and QC
Is the calibration still acceptable?
Do blanks and QC samples behave normally?
Does an independent verification check pass?
Step 5: Compare With Context
Does the result agree with previous trends, related parameters, and actual process conditions? If not, investigate the difference before automatically accepting or rejecting the result.
This sequence prevents one common response to unexpected laboratory data: “The number looks strange, so just measure it again.” Sometimes repeating the measurement is exactly the right action. But sometimes it simply reproduces the same underlying problem.
The Instrument Is Only One Part of the Measurement System
Modern water quality analyzers can make routine testing faster, easier, and more consistent. Features such as:
l automatic calibration functions,
l stored measurement methods,
l automatic wavelength selection,
l data logging,
l temperature compensation,
l QC records,
l and guided operating procedures
can reduce many common operational errors. But no analyzer operates independently from the rest of the analytical process.
A trustworthy measurement depends on the complete system: Sample → Preparation → Method → Reagents → Instrument → Calibration → QC → Interpretation. This is often described as the measurement process or analytical workflow. Reliable water quality data depends on controlling the entire workflow rather than focusing only on instrument specifications.
Weakness at any stage can affect the final result. This is why choosing a water quality analyzer should not be based only on specifications such as resolution, number of parameters, or measurement range. Laboratories should also consider how easily the instrument supports consistent routine procedures, calibration, verification, data review, and quality control.
Conclusion
A water test result should not be trusted simply because:
u the instrument is new,
u the display shows several decimal places,
u the reading is stable,
u calibration was performed earlier,
u or repeated tests produce similar numbers.
Reliable water analysis comes from a chain of controls. Before accepting an important result, ask:
1.Was the instrument properly calibrated?
2.Has measurement performance been verified?
3.Was the sample representative and properly handled?
4.Was the correct method and measurement range used?
5.Does the result agree with QC information and the overall water-quality context?
If these questions can be answered confidently, the number on the screen becomes much more than just a measurement. It becomes information that can support a real decision. And that is ultimately the purpose of routine water quality testing.