+852 46135220

In wastewater treatment, routine testing is often seen as a compliance activity: collect samples, measure the required parameters, record the results, and compare them with discharge limits.
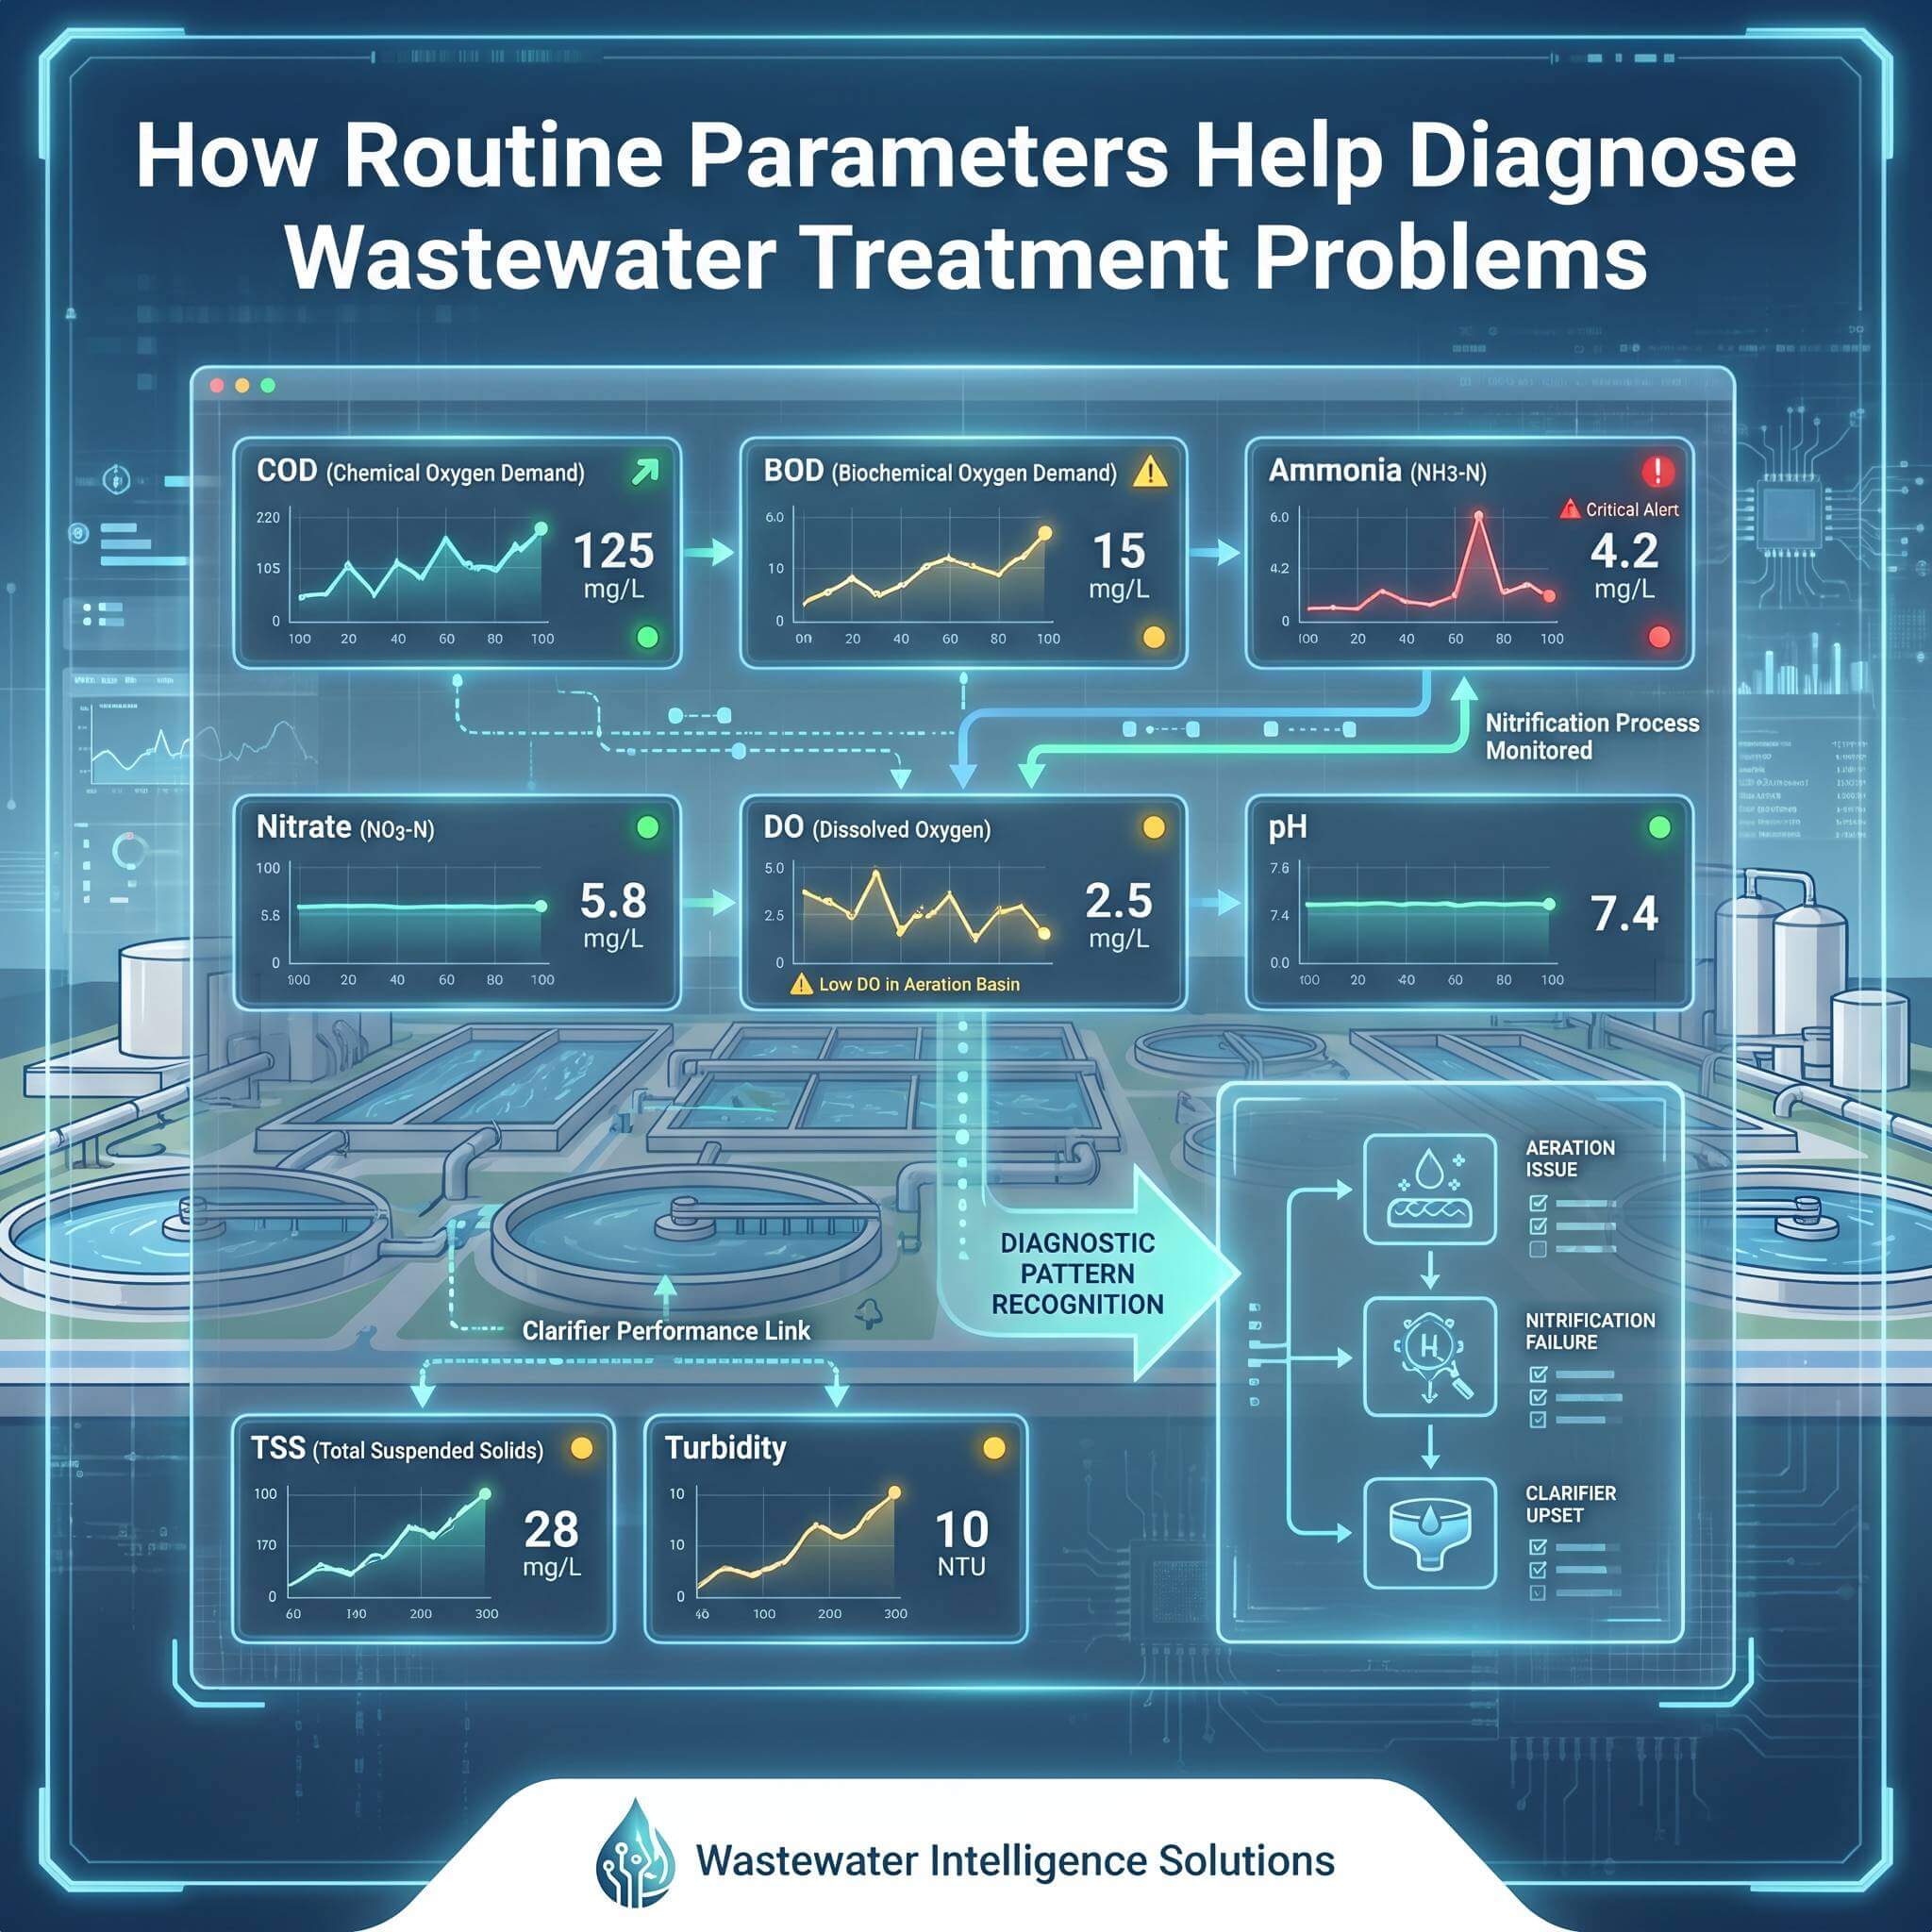
But in daily plant operation, routine parameters can do much more than confirm whether the effluent meets a standard. Routine wastewater parameters help diagnose process problems by showing how organic load, biological activity, nutrient conversion, solids separation, pH stability, and influent characteristics are changing. For example, COD and BOD indicate organic loading, ammonia and nitrate reflect nitrification and denitrification performance, TSS and turbidity reveal solids carryover, while pH, alkalinity, DO, conductivity, and temperature help identify process stress or influent changes. When these parameters are interpreted together, they provide early warning signs before final effluent quality fails. They can show whether organic loading is increasing, whether biological activity is stable, whether nitrification is complete, whether solids are escaping, or whether an upstream industrial discharge has changed the wastewater characteristics.
In other words, routine parameters are not just numbers. They are diagnostic signals.
Why Routine Parameters Matter in Wastewater Process Control
Wastewater treatment is a biological, chemical, and physical process. A single test result rarely explains the whole situation. For example, a high COD value may indicate increased organic load. But it does not tell us whether the problem comes from influent shock loading, poor aeration, insufficient retention time, toxic inhibition, or solids carryover. A high ammonia result may suggest incomplete nitrification. But the reason could be low dissolved oxygen, low temperature, insufficient sludge age, pH depression, alkalinity depletion, toxic influent, or overloading. This is why routine parameters should be read as a group.
The real value of wastewater testing comes from pattern recognition:
l What changed compared with normal operation?
l Which parameters changed together?
l Did the change appear first in the influent, biological tank, secondary clarifier, or final effluent?
l Is the issue related to organic matter, nutrients, solids, oxygen, pH, or salinity?
l Is the problem temporary, gradual, or worsening?
Routine testing helps answer these questions before a treatment problem becomes a discharge failure.
1. COD and BOD: Understanding Organic Load and Biodegradability
COD and BOD are two of the most important routine parameters for wastewater treatment.
COD, or Chemical Oxygen Demand, measures the oxygen equivalent required to chemically oxidize organic and some inorganic reducing substances in the sample. It is fast, practical, and widely used for process monitoring.
BOD, or Biochemical Oxygen Demand, reflects the oxygen consumed by microorganisms while degrading biodegradable organic matter over a defined period, commonly five days.
Both parameters are related to organic pollution, but they do not provide the same information.
COD is useful for fast operational feedback. BOD is more closely related to biological treatability and oxygen demand in natural receiving waters.
What COD Can Indicate
A sudden increase in influent COD may suggest:
u Higher organic loading
u Industrial discharge shock
u Food, chemical, textile, printing, dyeing, or manufacturing wastewater entering the system
u Poor equalization tank control
u Accidental discharge from upstream users
If COD increases in the final effluent, possible causes may include:
n Overloading of the biological process
n Insufficient aeration
n Short hydraulic retention time
n Toxic inhibition of microorganisms
n Poor sludge settling and solids carryover
n Incomplete degradation of slowly biodegradable organics
What the COD/BOD Relationship Can Suggest
In practical wastewater troubleshooting, the COD/BOD ratio is often more useful than either value alone. A relatively low COD/BOD ratio usually suggests better biodegradability, while a high COD/BOD ratio may indicate the presence of refractory, slowly biodegradable, or non-biodegradable organic compounds. However, the ratio should not be used mechanically. Sampling location, industrial wastewater composition, suspended solids, and analytical method differences can all affect the interpretation. The COD/BOD relationship is best used as a process trend indicator rather than a single-pass judgment.
If both COD and BOD increase, the plant may be receiving a higher biodegradable organic load. If COD increases but BOD does not increase proportionally, the wastewater may contain more non-biodegradable or slowly biodegradable compounds. If BOD removal drops while COD removal remains relatively stable, the biological community may be under stress, or the wastewater composition may have changed.
This is especially important for industrial wastewater, where COD may come from compounds that are not easily degraded by the biological system.
2. Ammonia Nitrogen: A Key Indicator of Nitrification Performance
Ammonia nitrogen is one of the most useful routine indicators for biological treatment performance. In municipal and many industrial wastewater systems, ammonia is converted to nitrate through nitrification under aerobic conditions. This process depends on nitrifying bacteria, which are generally more sensitive than ordinary organic-degrading bacteria. When ammonia rises in the effluent, it often means nitrification is incomplete.
Possible Causes of High Effluent Ammonia
High ammonia nitrogen may indicate:
u Low dissolved oxygen in the aeration tank
u Insufficient sludge age
u Low temperature affecting nitrifier activity
u Low pH or insufficient alkalinity
u Toxic compounds inhibiting nitrifying bacteria
u Organic overloading, where heterotrophic bacteria outcompete nitrifiers for oxygen
u Excessive sludge wasting
u Hydraulic shock loading
High effluent ammonia should not be diagnosed from the ammonia result alone. In many wastewater treatment plants, ammonia increase is a secondary symptom rather than the original cause. The real problem may be oxygen limitation, alkalinity depletion, excessive organic loading, low sludge age, toxic inhibition, or seasonal temperature decrease. A practical approach is to compare ammonia with nitrate, DO, pH, alkalinity, COD, and temperature at the same time. This helps determine whether the problem is related to nitrification failure, process overloading, or environmental stress on the biomass. For example:
l High ammonia + low DO may suggest oxygen limitation.
l High ammonia + low pH may suggest nitrification-related alkalinity depletion or poor pH control.
l High ammonia + high COD may suggest organic overloading.
l High ammonia + low nitrate may suggest nitrification is not occurring effectively.
l Low ammonia + high nitrate may suggest nitrification is working but denitrification may be incomplete.
3. Nitrate and Nitrite: Tracking Nitrogen Conversion
Nitrate and nitrite provide important clues about the nitrogen removal process. In a typical nitrification-denitrification system, ammonia is oxidized first to nitrite and then to nitrate under aerobic conditions. Then nitrate is reduced to nitrogen gas under anoxic conditions when sufficient carbon source is available.
What Nitrate Can Tell Us
High nitrate in final effluent may indicate:
u Nitrification is occurring
u Denitrification is incomplete
u Anoxic zone conditions are insufficient
u Internal recycle is not optimized
u Carbon source is insufficient
u Dissolved oxygen is too high in the anoxic zone
u Hydraulic retention time is too short
Low nitrate combined with high ammonia may indicate nitrification failure. Low ammonia and low nitrate may indicate good nitrogen removal, but the result should be checked together with total nitrogen if required.
What Nitrite Can Indicate
Nitrite is often an intermediate parameter. A nitrite increase may suggest unstable nitrification or denitrification. Possible causes include:
u Low dissolved oxygen
u Sudden load change
u Temperature change
u Toxic inhibition
u Imbalance between ammonia-oxidizing and nitrite-oxidizing bacteria
u Incomplete denitrification
Because nitrite can be unstable, it is especially useful as an early warning signal when a biological nitrogen removal process is becoming stressed.
4. Phosphate and Total Phosphorus: Evaluating Nutrient Removal
Phosphorus control is important in many wastewater treatment plants because excessive phosphorus discharge can contribute to eutrophication in receiving waters. Routine phosphorus testing may include orthophosphate, total phosphorus, or both. Orthophosphate represents the dissolved reactive form that is readily available. Total phosphorus includes dissolved and particulate phosphorus.
What Phosphorus Results Can Suggest
High effluent phosphate or total phosphorus may indicate:
u Insufficient chemical dosing
u Poor mixing of coagulant
u Inadequate biological phosphorus removal
u Solids carryover from the clarifier
u Return of phosphorus from sludge under anaerobic conditions
u Overloading of the treatment system
u Poor sludge wasting control
If total phosphorus is high but orthophosphate is not very high, particulate phosphorus from suspended solids may be the main issue. If both orthophosphate and total phosphorus are high, phosphorus removal itself may be insufficient. This distinction is important for process diagnosis. High orthophosphate usually points to insufficient dissolved phosphorus removal, while high total phosphorus with high TSS often points to solids separation failure. In chemical phosphorus removal systems, this may mean the coagulant dose, mixing condition, or sludge separation process needs to be checked. In biological phosphorus removal systems, it may indicate unstable anaerobic-aerobic cycling, sludge handling issues, or phosphorus release from sludge.
This is why phosphorus should be checked together with turbidity, TSS, sludge settling performance, and chemical dosing records.
5. Dissolved Oxygen: A Direct Signal of Biological Tank Conditions
Dissolved oxygen, or DO, is one of the most important field parameters in aerobic wastewater treatment. Microorganisms need oxygen to degrade organic matter and nitrify ammonia. However, too much aeration wastes energy and may disturb anoxic or anaerobic zones needed for nutrient removal.
Low DO May Cause
Low dissolved oxygen can lead to:
u Poor COD and BOD removal
u Incomplete nitrification
u Odor formation
u Filamentous bacteria growth in some cases
u Poor sludge settling
u Higher ammonia in effluent
Excessive DO May Also Create Problems
Very high DO does not always mean better treatment. Excessive aeration may:
u Increase energy cost
u Carry oxygen into anoxic zones
u Reduce denitrification efficiency
u Break up flocs under excessive mixing conditions
u Make process control less stable
Therefore, DO should be controlled according to process purpose, not simply kept as high as possible. Aerobic zones require sufficient oxygen for organic removal and nitrification, but anoxic zones require low oxygen conditions for denitrification. If DO control is not matched to the treatment objective, one part of the process may improve while another part becomes less efficient.
DO is not only a parameter to be recorded. It is a process control signal that should be connected with ammonia, nitrate, COD removal, blower operation, and aeration pattern.
6. pH and Alkalinity: Protecting Biological Stability
pH affects almost every biological and chemical process in wastewater treatment. Most biological treatment processes operate best within a relatively stable pH range. Sudden pH changes can inhibit microorganisms, reduce nitrification efficiency, affect chemical precipitation, and change the toxicity of certain compounds.
What pH Changes May Indicate
Low pH may suggest:
u Acidic industrial discharge
u Nitrification consuming alkalinity
u Poor buffering capacity
u Chemical overdosing
u Anaerobic fermentation effects
High pH may suggest:
u Alkaline industrial wastewater
u Excessive chemical addition
u Cleaning chemical discharge
u Photosynthetic activity in some open systems
Alkalinity is especially important for nitrification because nitrifying bacteria consume alkalinity during ammonia oxidation. If alkalinity is depleted, pH can drop and nitrification may become unstable. In many wastewater plants, a gradual pH decrease during good nitrification is not unusual because ammonia oxidation consumes alkalinity. However, if alkalinity is not sufficient, the pH may fall to a level where nitrifying bacteria become less active. This can create a feedback problem: nitrification starts, alkalinity drops, pH decreases, and nitrification then becomes inhibited.
For this reason, alkalinity is not only a chemical parameter. It is also a stability indicator for biological nitrogen removal.
7. TSS and Turbidity: Identifying Solids Separation Problems
Total Suspended Solids, or TSS, measures the mass of suspended particles in wastewater. Turbidity measures the optical scattering caused by particles. They are not the same parameter, but they are closely related in many routine wastewater applications. High TSS or turbidity in final effluent often indicates a solids separation issue.
Possible Causes of High TSS or Turbidity
High effluent solids may be caused by:
u Poor sludge settling
u Sludge bulking
u Rising sludge in the secondary clarifier
u Hydraulic overloading
u Excessive return sludge flow
u Low sludge concentration or weak floc formation
u Toxic shock affecting biomass structure
u Chemical coagulation failure
u Filter breakthrough in tertiary treatment
If COD, BOD, phosphorus, and turbidity all increase together in the final effluent, the issue may not only be biological degradation. It may be solids carryover. This is important because particulate organic matter and particulate phosphorus can raise COD, BOD, and total phosphorus results.
TSS is a mass-based measurement, while turbidity is an optical measurement. A sample with fine particles may show high turbidity even when TSS is not extremely high, while heavier settleable solids may contribute more to TSS. For process diagnosis, turbidity is useful for fast trend monitoring, while TSS provides a more direct measurement of suspended solids concentration.
8. Conductivity: Detecting Salinity and Industrial Influences
Conductivity measures the ability of water to conduct electrical current, which is related to the concentration of dissolved ions. In wastewater treatment, conductivity is useful for detecting changes in influent composition. A sudden increase in conductivity may suggest:
u Industrial discharge
u High salt wastewater
u Chemical cleaning wastewater
u Brine discharge
u Infiltration of saline water
u Changes in upstream production processes
High salinity can affect biological treatment because microorganisms may become stressed when ionic strength changes suddenly. Conductivity is especially useful as a screening parameter. It can quickly show that the wastewater matrix has changed, but it cannot identify whether the change comes from chloride, sulfate, sodium, cleaning chemicals, acids, alkalis, or other dissolved ions. When conductivity changes significantly, additional targeted testing may be needed to identify the source. When conductivity changes together with COD, pH, ammonia, or toxicity indicators, operators should investigate upstream sources.
9. Temperature: A Simple Parameter with Strong Process Impact
Temperature affects microbial activity, oxygen transfer, chemical reaction rates, and sludge settling behavior. In biological wastewater treatment, lower temperatures usually slow down microbial reactions, especially nitrification. This means that a plant may perform well in warm seasons but show higher ammonia in cold periods, even if the influent load does not change significantly.
Temperature should be considered when evaluating:
l Nitrification performance
l Required sludge age
l Aeration efficiency
l Biological reaction rate
l Seasonal process changes
l Chemical dosing performance
A result that looks abnormal in summer may be normal in winter, and a process setting that works in warm weather may not be sufficient in cold weather.
How to Diagnose Process Problems Using Parameter Combinations
The most useful approach is not to ask, “Is this parameter high or low?”
A better question is: “What combination of parameters changed, and what process problem does that pattern suggest?”
Quick Diagnostic Guide: Parameter Patterns and Possible Process Problems
Parameter Pattern | Possible Process Problem | What to Check Next |
High COD + high BOD + low DO | Organic overloading | Influent load, aeration capacity, equalization tank, sludge concentration |
High ammonia + low nitrate | Incomplete nitrification | DO, pH, alkalinity, sludge age, temperature, toxic inhibition |
Low ammonia + high nitrate | Nitrification working, denitrification limited | Anoxic zone, carbon source, internal recycle, DO carryover |
High total phosphorus + high TSS | Particulate phosphorus carryover | Clarifier performance, sludge settling, turbidity, chemical dosing |
High turbidity + high effluent COD | Solids carryover instead of only poor biodegradation | TSS, sludge blanket, return sludge flow, filter condition |
Sudden conductivity increase + pH shift | Industrial discharge or chemical shock | Upstream source, influent sampling, toxicity signs, production discharge |
Low pH + high ammonia | Nitrification stress or alkalinity depletion | Alkalinity, ammonia load, aeration, chemical addition |
High nitrite | Unstable nitrogen conversion | DO, temperature, loading change, nitrifier inhibition |
Below are some common diagnostic patterns.
Pattern 1: High COD, High BOD, Low DO, and Rising Effluent Ammonia
This pattern may suggest organic overloading. When organic load increases, heterotrophic bacteria consume more oxygen. If aeration is not sufficient, DO drops. Nitrifying bacteria may then become oxygen-limited, causing ammonia to rise. Possible actions include:
n Check influent loading trend
n Review equalization tank operation
n Increase aeration if appropriate
n Check blower and diffuser performance
n Review sludge concentration and sludge age
n Investigate upstream discharge changes
Pattern 2: High Ammonia, Low Nitrate, Low DO
This pattern often suggests nitrification failure due to insufficient oxygen. Possible actions include:
n Check DO in aeration zones
n Inspect aeration equipment
n Check diffuser fouling
n Review ammonia loading
n Review sludge age
n Check pH and alkalinity
Pattern 3: High Ammonia, Low pH, Low Alkalinity
This pattern may suggest nitrification stress caused by insufficient buffering capacity. As nitrification consumes alkalinity, pH may drop. If pH falls too low, nitrifying bacteria become less active, and ammonia removal becomes unstable. Possible actions include:
n Measure alkalinity in influent and aeration tank
n Check pH trend
n Review ammonia loading
n Consider alkalinity supplementation if appropriate
n Avoid sudden process changes that further stress nitrifiers
Pattern 4: Low Ammonia, High Nitrate, High Total Nitrogen
This pattern may suggest that nitrification is working, but denitrification is incomplete. Possible causes include:
u Insufficient anoxic volume
u Too much DO entering the anoxic zone
u Insufficient carbon source
u Poor internal recycle control
u Short retention time
u Inappropriate mixing conditions
Possible actions include:
n Check nitrate in different process zones
n Review internal recycle rate
n Check DO in anoxic zone
n Evaluate carbon availability
n Review influent COD/N ratio
Pattern 5: High TSS, High Turbidity, High Total Phosphorus
This pattern may suggest solids carryover. Phosphorus may be leaving the system in particulate form with suspended solids. Possible causes include:
u Clarifier overload
u Poor sludge settling
u Sludge bulking
u Rising sludge
u Poor return sludge control
u Chemical coagulation issue
Possible actions include:
n Check sludge settling test
n Review sludge blanket level
n Check return activated sludge flow
n Review wasting rate
n Inspect clarifier operation
n Compare orthophosphate and total phosphorus results
Pattern 6: Sudden Conductivity Increase with pH Shift
This pattern may suggest an upstream industrial discharge or chemical input. Possible causes include:
u Cleaning wastewater
u Brine discharge
u Acid or alkaline wastewater
u Production change from industrial users
u Chemical spill or batch discharge
Possible actions include:
n Check influent sampling time
n Compare with upstream monitoring points
n Review industrial user discharge records
n Check toxicity or biological inhibition signs
n Increase monitoring frequency during the event
Why One Parameter Is Not Enough
Routine parameters are powerful diagnostic tools, but they can be misleading if interpreted without process context. Some common misinterpretations include:
l Assuming high COD always means poor biological treatment, when it may be caused by influent shock loading or solids carryover.
l Assuming high ammonia always means low DO, when it may also result from low sludge age, low alkalinity, toxic inhibition, or low temperature.
l Assuming high total phosphorus always means chemical dosing failure, when it may be caused by suspended solids escaping from the clarifier.
l Assuming normal pH means the biological system is stable, even when alkalinity is nearly depleted.
l Assuming low turbidity means all dissolved pollutants are under control.
The purpose of routine testing is not only to detect abnormal values, but to understand what those values mean in the treatment process.
Wastewater treatment is a connected system. Each parameter gives one part of the story. The diagnosis becomes more reliable when routine parameters are combined with process knowledge, sampling location, timing, historical trends, and operating data.
Practical Testing Strategy for Wastewater Plants
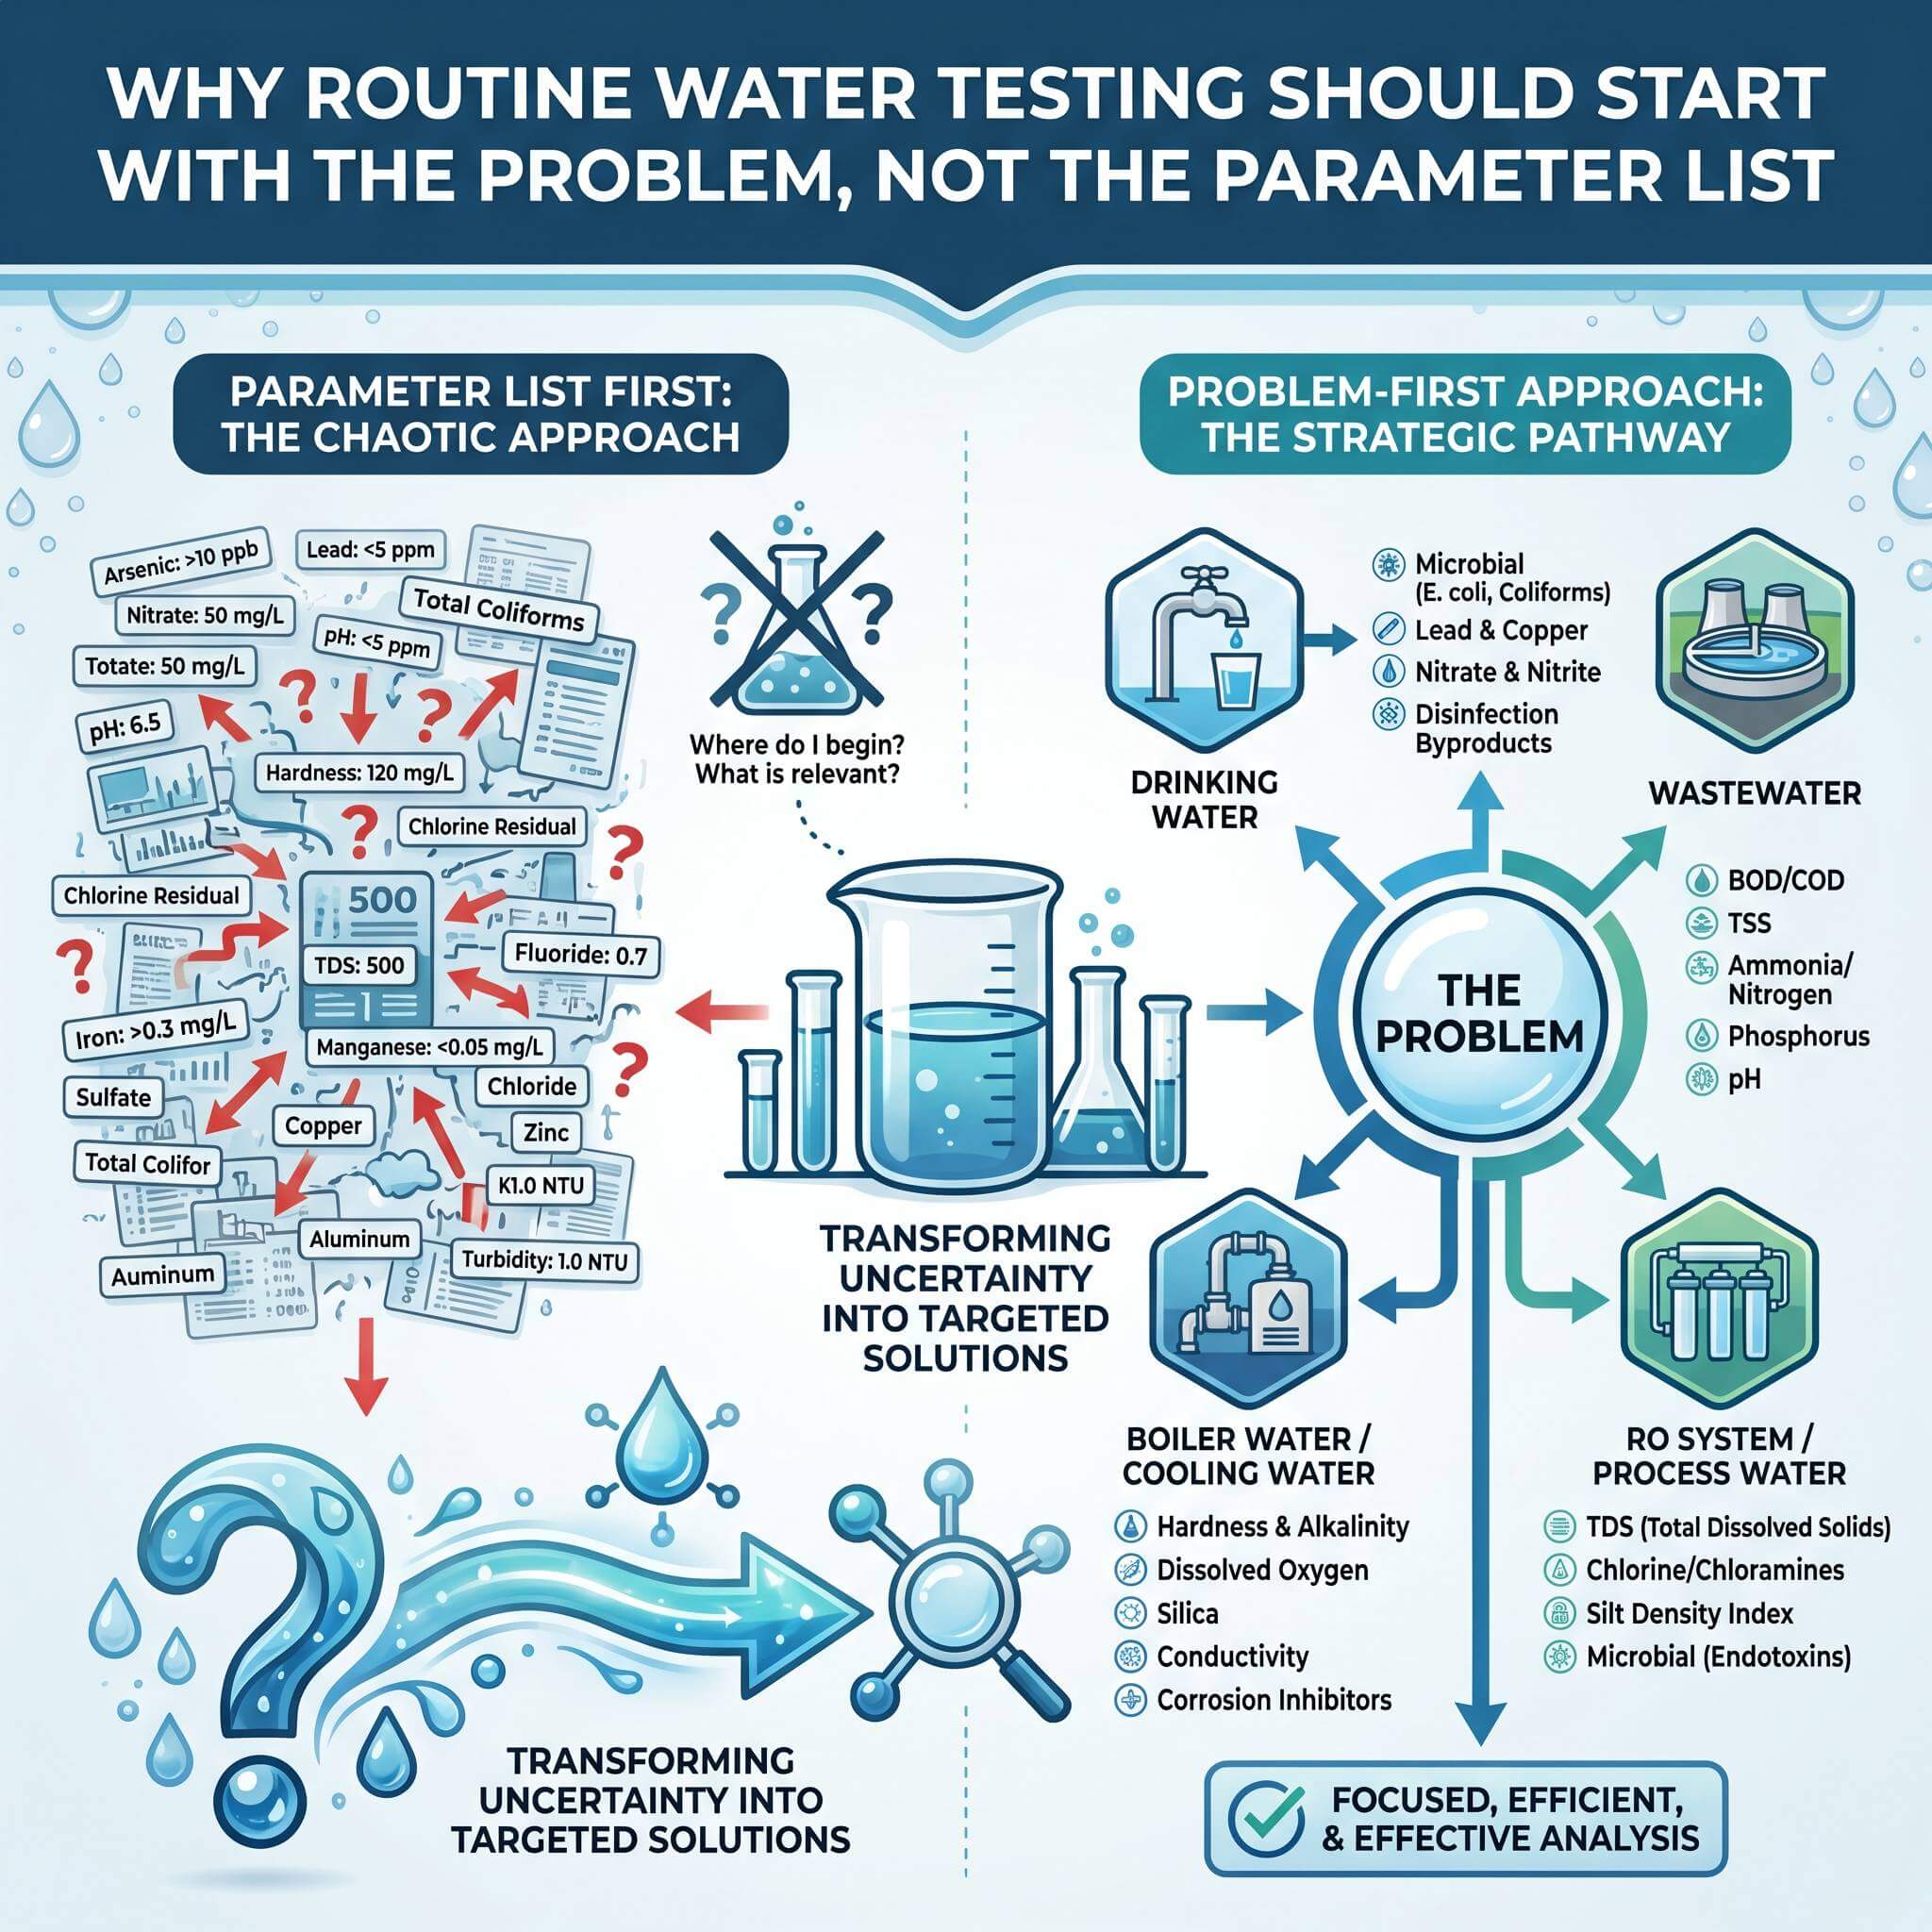
For routine wastewater process diagnosis, testing should be designed around process questions. Instead of only asking, “Which parameters are required by regulation?” operators can also ask:
n What problem are we trying to detect early?
n Which parameters change before the final effluent fails?
n Which sampling points help locate the problem?
n Which parameters should be tested daily, weekly, or during abnormal events?
n Which results need fast field measurement?
n Which results require laboratory confirmation?
A practical routine testing plan may include:
Routine Testing Plan | Useful Parameters | Purpose |
Influent Monitoring | COD;BOD;pH;Conductivity;Ammonia nitrogen;Total nitrogen;Total phosphorus;TSS;Temperature | Understand incoming load;Detect shock loading;Identify industrial discharge changes;Support aeration and sludge control decisions;Maintain biomass stability |
Biological Tank Monitoring | DO;pH;Temperature;Ammonia;Nitrate;MLSS;Sludge settleability;Alkalinity | Evaluate biological activity;Diagnose nitrification and denitrification;Control aeration |
Secondary Clarifier Monitoring | Sludge blanket level;TSS;Turbidity;Settleability;Return sludge condition | Detect solids separation problems;Prevent sludge washout;Understand whether effluent deterioration comes from poor settling |
Final Effluent Monitoring | COD;BOD;TSS;Ammonia;Total nitrogen;Total phosphorus;pH;Conductivity;Turbidity | Confirm treatment performance;Support compliance;Detect abnormal trends before discharge limits are exceeded |
From Compliance Testing to Process Understanding
Compliance testing tells whether the final effluent meets the required limit. Process testing helps explain why the result is good or bad. Both are necessary, but they serve different purposes.
A wastewater plant that only tests final effluent may discover problems too late. A plant that monitors routine parameters across the process can often detect early warning signs before effluent quality deteriorates. Routine parameters help operators move from reaction to prevention. They support better decisions on aeration, sludge wasting, chemical dosing, recycle control, equalization, and upstream source investigation.
Conclusion
Routine wastewater parameters help diagnose process problems by converting treatment performance into measurable signals. COD and BOD show organic loading, ammonia and nitrate reveal nitrogen conversion, phosphate and total phosphorus indicate nutrient removal performance, DO and pH reflect biological conditions, TSS and turbidity show solids separation, and conductivity helps detect wastewater composition changes. The most reliable diagnosis comes from interpreting these parameters together rather than judging each result separately.
When these parameters are interpreted together, they help reveal the condition of the treatment process:
l Is the organic load increasing?
l Is the biological system healthy?
l Is nitrification complete?
l Is denitrification limited?
l Is phosphorus removal working?
l Are solids escaping from the clarifier?
l Has the influent wastewater changed?
l Is the problem biological, chemical, physical, or operational?
This is the real value of routine wastewater testing. It is not just about measuring more parameters. It is about using the right parameters to understand the process problem.