+852 46135220

In water quality testing, one of the most common and frustrating situations is this:
A plant operator tests a water sample on site and gets one result.
A laboratory tests what seems to be the same water sample and reports a different result.
A customer tests again with another instrument and obtains a third value.
The immediate reaction is often: “Which result is wrong?”
But in many cases, this is not the right first question. Two water test results can be different because they may not come from the same sampling condition, sample condition, testing method, calibration setup, sample preparation procedure, or reporting basis. In many cases, the instruments are not necessarily wrong. The results may differ because each test is measuring the sample under different conditions or for a different purpose.
Before judging which result is correct, laboratories should compare:
l Where and when the sample was collected
l How the sample was preserved and transported
l Whether the same method and parameter form were used
l Whether calibration and quality control were properly verified
l Whether the results were reported in the same unit and chemical basis
In water quality testing, a result is reliable only when the full testing process behind the number is understood.
1. The Same Water Source Does Not Always Mean the Same Sample
Many disagreements begin with a simple assumption: “We tested the same water.”
But did both tests really use the same sample? In water quality testing, water is not always homogeneous. Even within the same tank, pipe, river, pond, treatment outlet, or wastewater stream, the composition can change from one point to another. For example:
u Suspended solids may not be evenly distributed.
u Sludge particles may settle quickly.
u Chemical dosing may not be fully mixed.
u Industrial wastewater may fluctuate by production batch.
u Chlorine residual may change across the distribution system.
u pH may vary between surface and deeper layers in some water bodies.
If one sample is taken near the outlet and another is taken from a stagnant corner, the results may naturally be different. This is especially important for parameters such as turbidity, suspended solids, COD, color, residual chlorine, ammonia nitrogen, phosphate, and metals. Even if both samples come from the same location, timing also matters. A sample collected at 9:00 a.m. may not represent the same water condition as a sample collected at 11:00 a.m., especially in wastewater treatment, industrial discharge, aquaculture, or process water monitoring.
So before comparing two test results, the first question should be: Were the samples truly collected from the same point, at the same time, under the same sampling conditions? If not, the difference may reflect real water variation rather than testing error.
2. Water Samples Can Change Before Testing
Another common reason for different results is sample change during storage or transport. Water is not a static material. Once collected, the sample may continue to react, oxidize, degrade, absorb gases, release gases, settle, or interact with the container.
Some parameters are especially sensitive:
pH
pH can change when carbon dioxide enters or leaves the sample. Temperature changes can also affect pH readings. If a field pH test is performed immediately, but the laboratory test is performed hours later, the two results may not match exactly.
Residual chlorine
Free chlorine and total chlorine can decrease quickly, especially when organic matter, reducing substances, sunlight, or high temperature are present. A chlorine result measured on site may be higher than a result measured later in the laboratory.
Turbidity
Particles may settle during transport. If the sample is not properly mixed before testing, turbidity may appear lower than it was at the time of sampling.
Ammonia nitrogen
Microbial activity, pH change, and storage conditions may affect nitrogen-related parameters. Poor preservation can make results less representative.
COD and color
Wastewater samples may continue to undergo chemical or biological changes after collection. Suspended matter may also settle, leading to differences between mixed and unmixed portions.
This is why sample preservation, holding time, container selection, temperature control, and pretreatment procedures are so important. A laboratory result may be technically correct for the sample as received, while a field result may be technically correct for the sample at the moment of collection. The two numbers are different because the sample condition changed.
The instrument did not necessarily fail. The sample may no longer be the same.
3. Different Methods May Not Measure the Same Form of the Parameter
One of the biggest sources of confusion in water quality testing is assuming that the same parameter name always means the same measurement. In reality, many water quality parameters have different forms.
Free chlorine vs. total chlorine
Free chlorine and total chlorine are not the same. Free chlorine mainly refers to available disinfecting chlorine, while total chlorine includes free chlorine and combined chlorine. If one test reports free chlorine and another reports total chlorine, different values are expected.
Ammonia vs. ammonia nitrogen
Some results are reported as ammonia, while others are reported as ammonia nitrogen. These are related but not numerically identical. If the unit basis is not checked carefully, the comparison can be misleading.
Phosphate vs. phosphorus
Orthophosphate, reactive phosphate, total phosphorus, and phosphorus as P may represent different analytical targets. A photometric phosphate method may not be directly comparable with a total phosphorus digestion method.
COD methods
COD results may vary depending on digestion conditions, reagent range, chloride interference control, sample dilution, digestion time, and whether the sample is fully homogenized.
Dissolved vs. total metals
A filtered sample may represent dissolved metals. An unfiltered and digested sample may represent total recoverable metals. These two results can be very different, especially in water containing suspended solids.
This is why the method name matters as much as the parameter name. In water analysis, the “same parameter” may not always mean the same analytical form. The reporting form, chemical species, sample preparation, and calculation basis must be checked before comparing results.
When two results differ, ask: Are both methods measuring the same chemical form, using the same sample preparation procedure, and reporting the same basis? If not, both results may be valid — but they are answering different analytical questions.
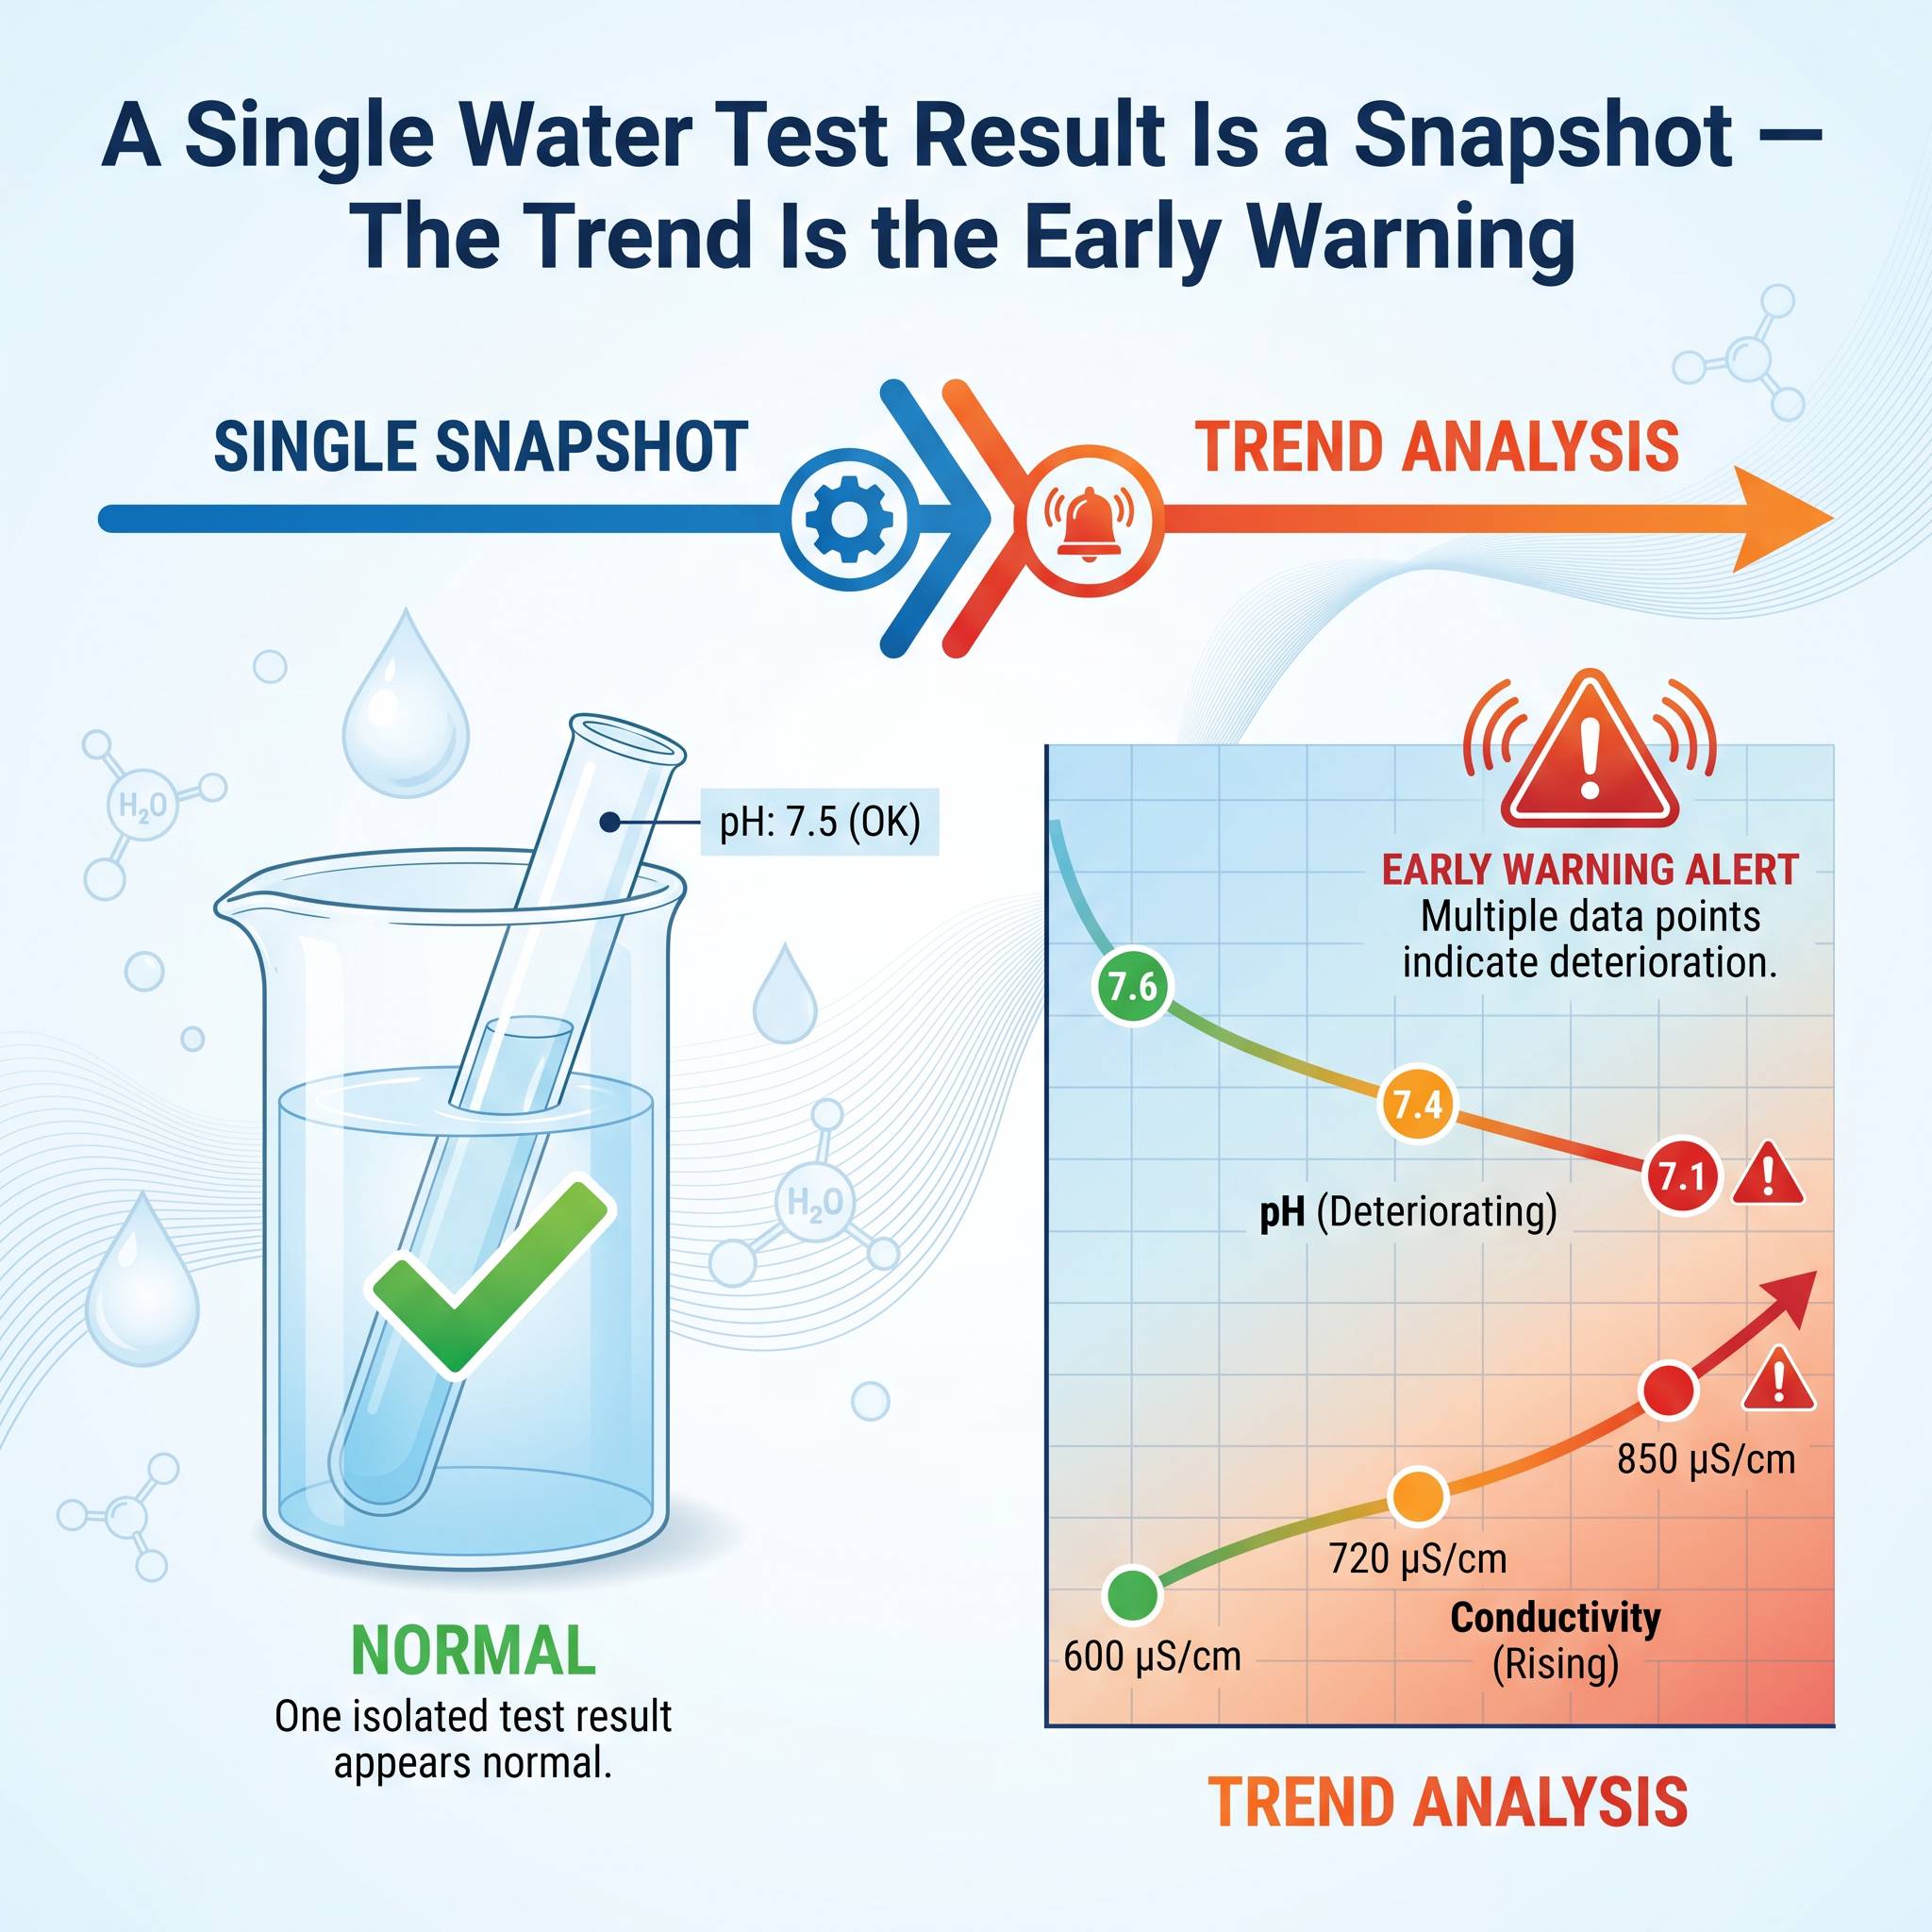
4. Field Testing and Laboratory Testing Serve Different Purposes
Field testing and laboratory testing are both important, but they are not the same job.
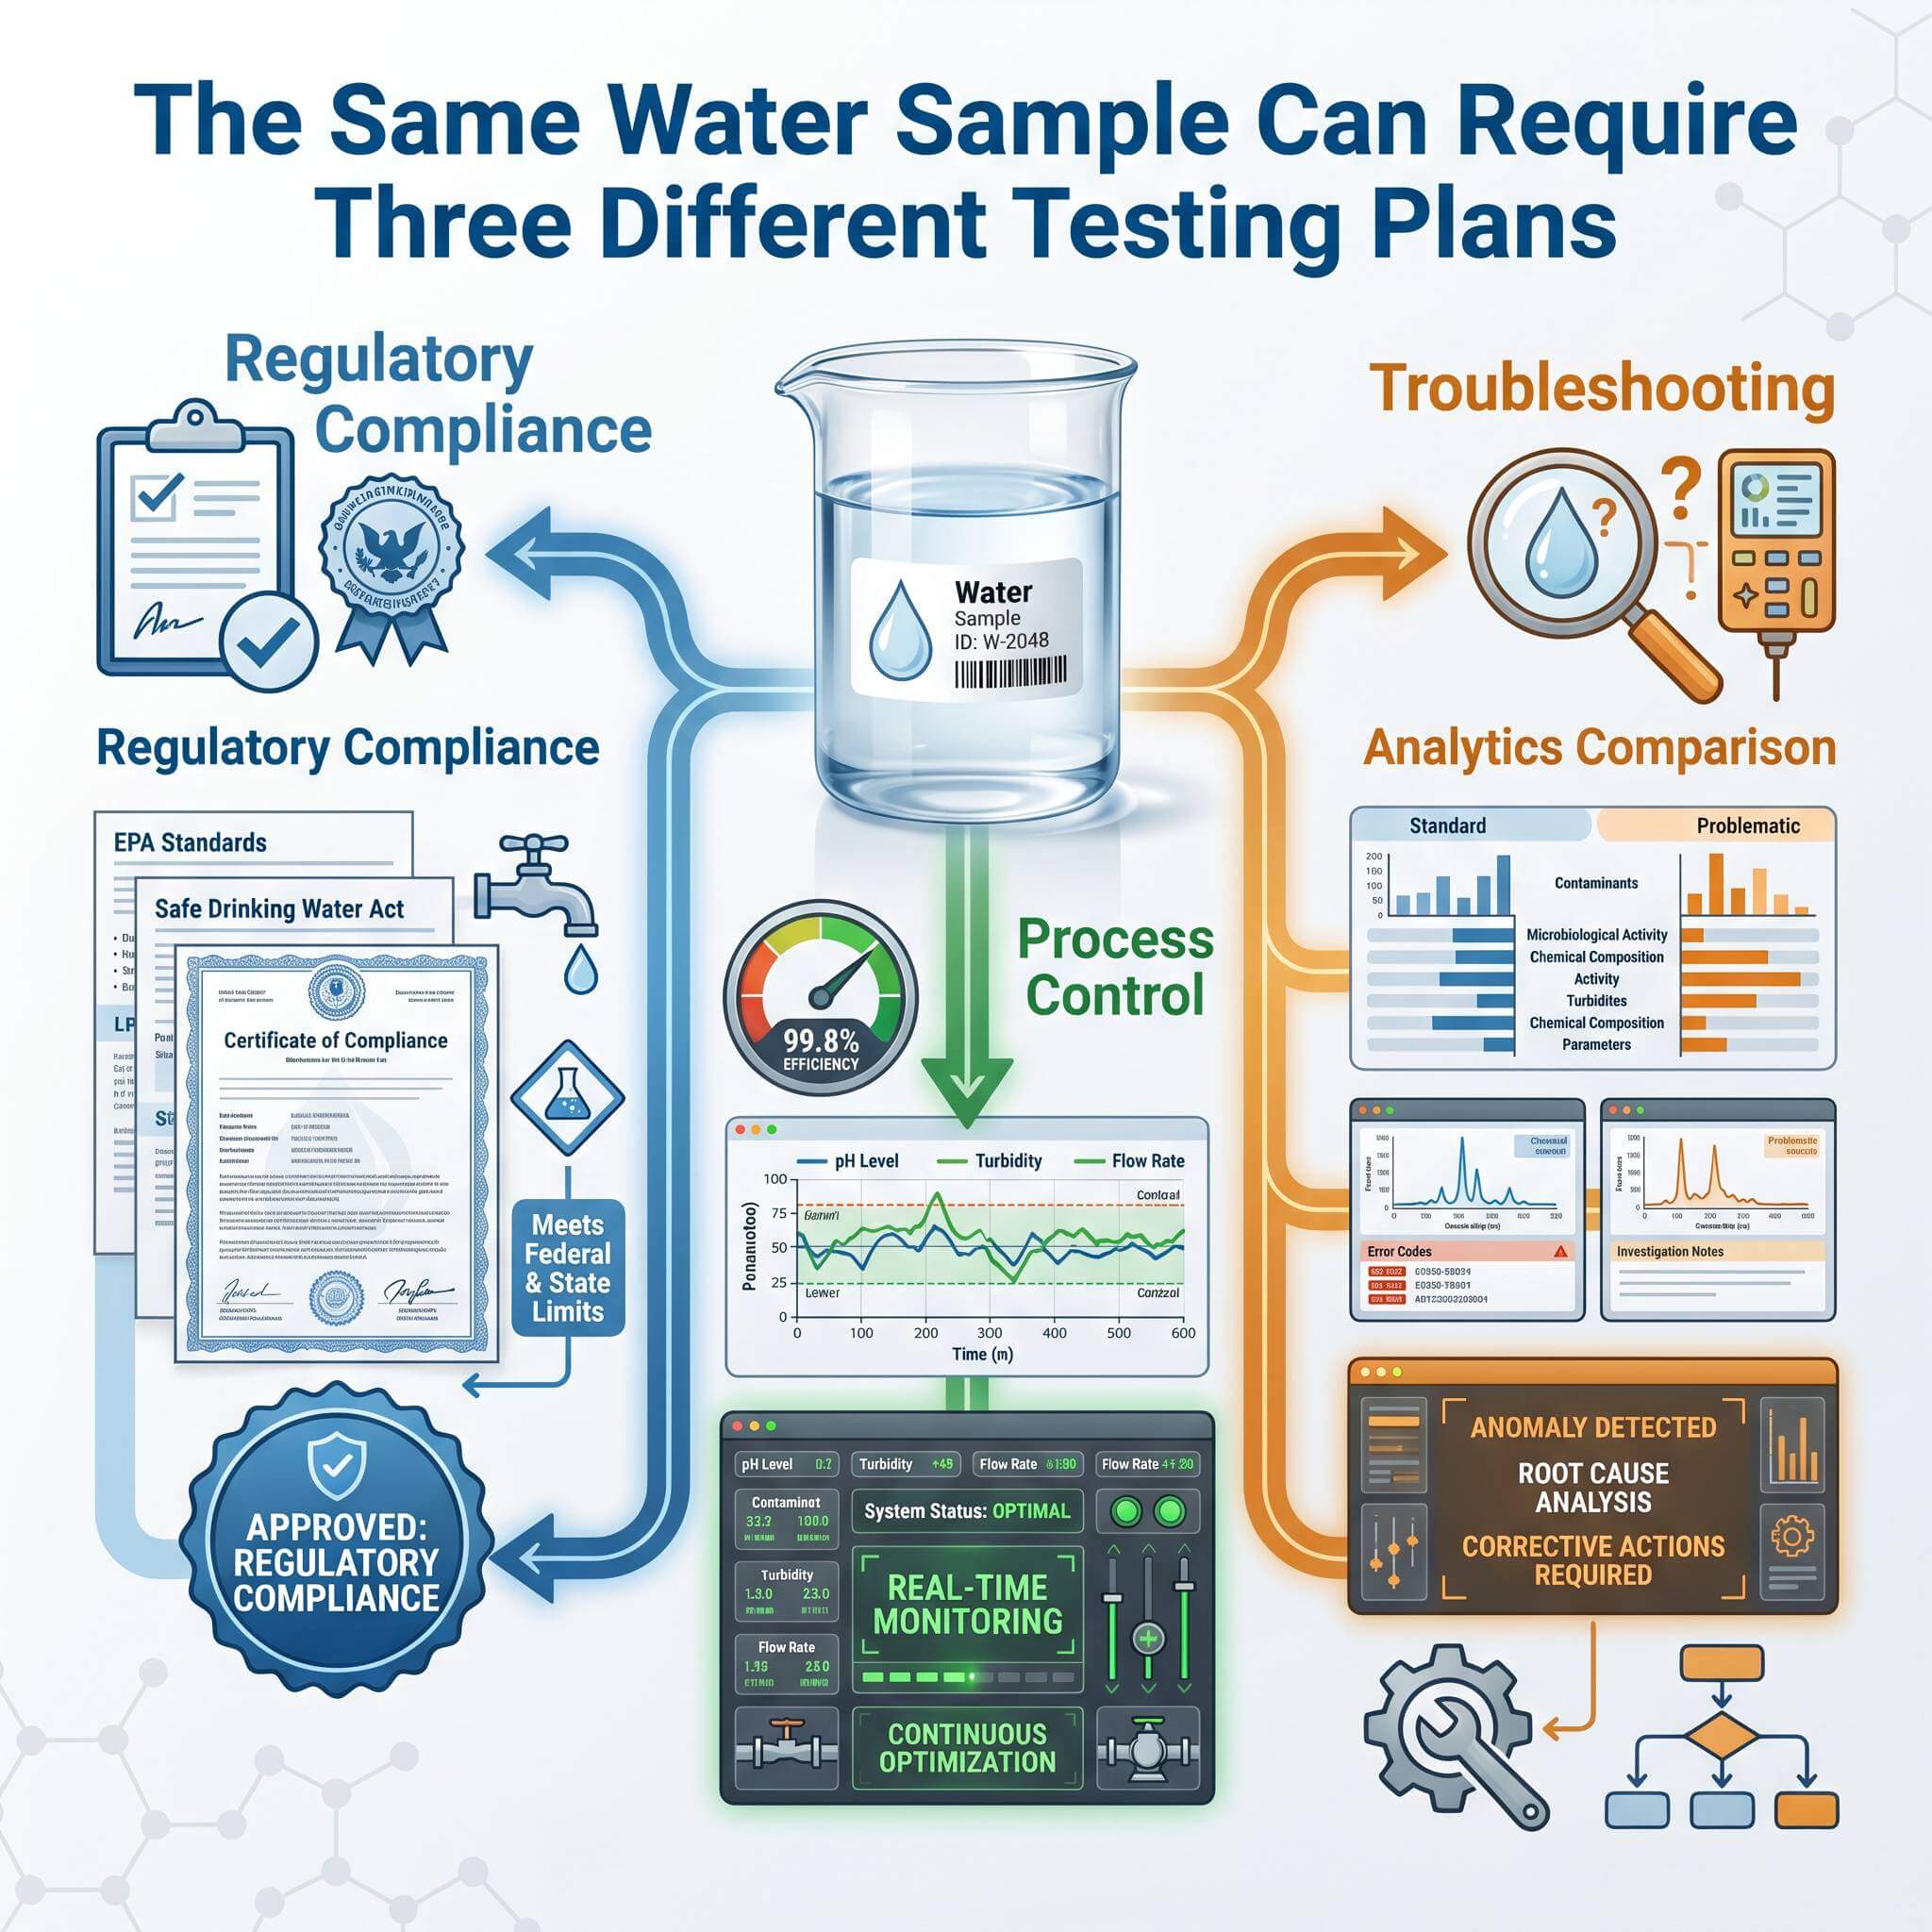
Field testing is often used for:
l Rapid screening
l Process control
l On-site troubleshooting
l Operational decisions
l Immediate adjustment of treatment systems
Laboratory testing is often used for:
n Confirmatory analysis
n Compliance reporting
n Higher-precision measurement
n More controlled sample preparation
n Documented quality assurance procedures
A portable photometer, pH meter, conductivity meter, or chlorine meter can provide fast and practical results in the field. However, the testing environment may include temperature variation, limited sample preparation, outdoor lighting, operator differences, and time pressure.
A laboratory instrument may operate under more controlled conditions, but the sample may have changed by the time it reaches the laboratory.
Therefore, a field result and a laboratory result may differ because they represent different stages of the sample’s life cycle:
l Field test: result at the sampling site and sampling time
l Laboratory test: result after transport, preservation, preparation, and controlled analysis
The question should not always be: “Which one is correct?”
A better question is: “Which result is more suitable for the decision we need to make?”
For process control, the immediate field result may be more useful. For formal reporting, the laboratory result may be required. For troubleshooting, both results may provide valuable information.
5. Calibration and Verification Conditions May Differ
Even when two instruments are working properly, calibration differences can create small but meaningful result differences. For example:
l One instrument may be calibrated recently.
l Another may only have been factory calibrated.
l One lab may use a certified standard.
l Another may use an older or different standard solution.
l One method may include blank correction.
l Another may not.
l One operator may verify accuracy near the sample concentration.
l Another may verify only at the midpoint.
Calibration is not a formality in water quality testing. It defines the relationship between instrument response and reported concentration. For low-level testing, calibration differences become even more important. A small blank value, reagent background, or calibration curve deviation may have a large effect on the final result. That’s why low-level water testing is more difficult than many users think.
This is especially relevant when results are close to:
u The method detection limit
u The lowest calibration point
u A regulatory limit
u A customer specification
u A process alarm threshold
In these cases, two results may not be dramatically different in absolute terms, but the decision impact can be significant. For example, a result of 0.48 mg/L and another result of 0.55 mg/L may look close analytically, but if the decision limit is 0.50 mg/L, they may lead to different actions.
This is why laboratories should not only ask whether an instrument gives a stable number. They should also ask whether calibration, verification, blank control, and quality control support the decision. Calibration verification is especially important when two results are close to a decision limit. A calibration curve may look acceptable overall, but the result may still be less reliable near the lowest calibration point or near the edge of the method range. This is why laboratories should verify performance near the concentration level that matters for the actual sample.
6. Sample Preparation Can Change the Result
Before a sample reaches the instrument, it may go through several preparation steps. These may include:
l Mixing
l Settling
l Filtration
l Dilution
l Digestion
l pH adjustment
l Reagent addition
l Color development
l Heating
l Cooling
l Blank correction
Each step can influence the final result. For example, filtering a sample before testing may remove suspended particles. This may be appropriate for dissolved parameters, but not for total parameters.
Dilution may reduce interference, but it can also increase uncertainty if not performed accurately. Digestion may convert bound forms into measurable forms, but incomplete digestion may lead to lower recovery. Heating time and temperature can affect COD digestion or other colorimetric reactions. Color development time can also be important in photometric methods. Reading too early or too late may produce a different absorbance value.
This is why standard operating procedures are important. If two laboratories prepare the sample differently, their results may not be directly comparable. Again, both results may be “correct” according to their own procedures, but they may not represent the same analytical condition.
7. Matrix Effects and Interference Can Affect One Method More Than Another
Water samples are not always clean and simple. Real samples may contain:
l Color
l Turbidity
l Suspended solids
l Organic matter
l Salinity
l Oxidizing agents
l Reducing agents
l High hardness
l High chloride
l Heavy metals
l Industrial chemicals
l Surfactants
These components may interfere with some methods more than others. In photometric testing, sample color and turbidity can affect light absorption. In electrochemical testing, temperature, ionic strength, electrode condition, and sample matrix can influence readings. In digestion-based methods, chloride or other substances may interfere if not properly controlled.
This does not mean the instrument is bad. It means the sample matrix must be considered. A method that works well for clean drinking water may not perform the same way in colored wastewater, high-salinity water, or heavily contaminated industrial discharge. That is why method selection should always consider the sample type.
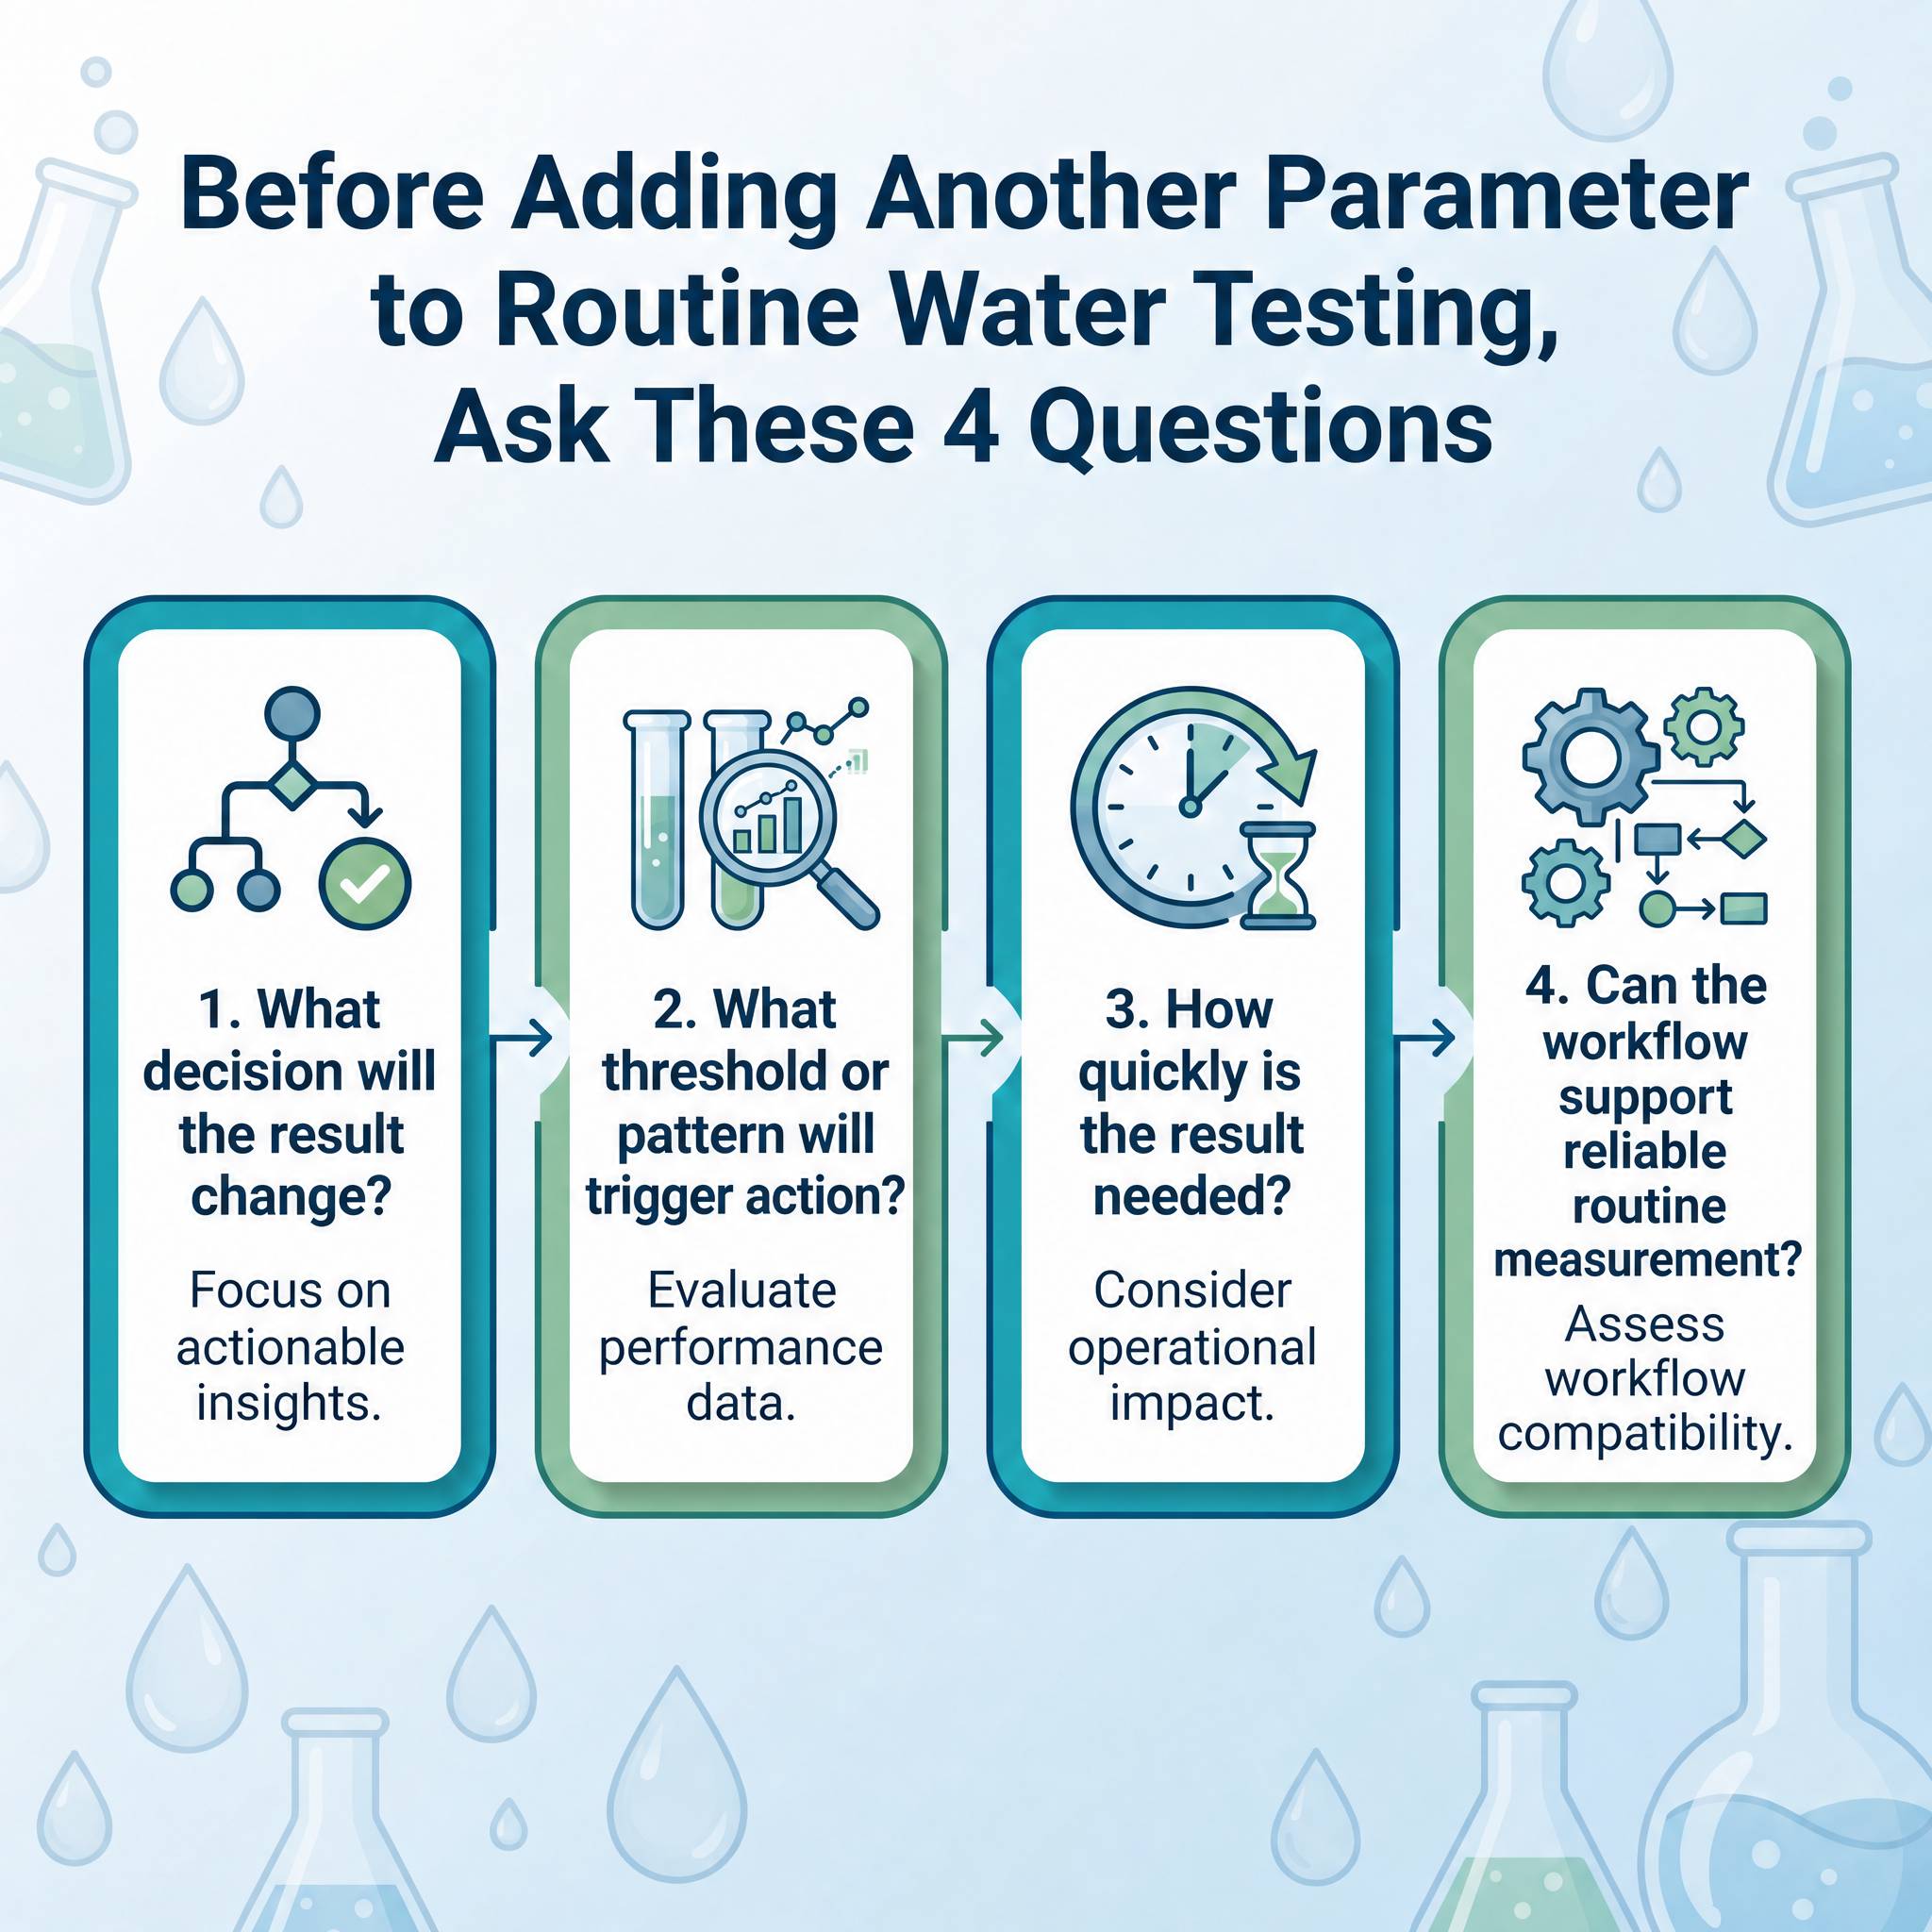
A good question is not only: “Can this instrument measure this parameter?”
The better question is: “Is this method suitable for this sample matrix and this decision?”
8. Reporting Units and Calculation Basis Can Cause Apparent Differences
Sometimes two results appear different simply because they are not reported in the same way. Common reporting differences include:
l mg/L vs µg/L
l ppm vs mg/L
l as N vs as NH₃
l as P vs as PO₄
l CaCO₃ basis vs ion basis
l filtered vs unfiltered
l total vs dissolved
l wet basis vs dry basis
l corrected vs uncorrected result
For example, ammonia nitrogen reported as NH₃-N is not the same numerical value as ammonia reported as NH₃. Phosphate reported as PO₄ is not the same numerical value as phosphorus reported as P. If the reporting basis is overlooked, users may think the instruments disagree, when the actual issue is unit conversion or parameter definition.
Before judging two results, always check:
n Parameter name
n Chemical form
n Unit
n Reporting basis
n Dilution factor
n Method range
n Detection limit
n Sample preparation notes
Many “result conflicts” are actually reporting conflicts.
9. Precision, Uncertainty, and Method Range Matter
No water test result is perfectly exact. Every method has a range, precision, repeatability, and uncertainty. When two results are close, they may be statistically consistent even if the numbers are not identical. For example:
l One result: 1.02 mg/L
l Another result: 1.10 mg/L
These values may appear different, but depending on the method uncertainty, they may be practically equivalent.
On the other hand:
u One result: 0.02 mg/L
u Another result: 0.08 mg/L
This difference may be important if both results are near the detection limit or compliance limit. This is why the concentration level matters. At very low concentrations, small absolute differences can be large relative differences. Near the upper end of the method range, dilution and linearity may become more important.
A reliable result should be interpreted together with:
ü Method range
ü Calibration range
ü Repeatability
ü QC results
ü Detection limit
ü Quantitation limit
ü Sample matrix
ü Decision requirement
A number without context can easily be misunderstood.
10. What Should a Lab Check When Two Results Are Different?
When two water test results do not match, it is usually not helpful to immediately blame the instrument or operator. A more systematic review is needed.
Here is a practical checklist.
Cause of Difference | What It Means | Example |
Sampling difference | Samples were not collected under the same conditions | Outlet sample vs. tank surface sample |
Holding time | Sample changed before testing | Chlorine decreased before lab analysis |
Method difference | Methods measured different forms | Free chlorine vs. total chlorine |
Preparation difference | Sample was filtered, digested, diluted, or mixed differently | Dissolved metals vs. total metals |
Calibration difference | Instruments were verified under different conditions | Mid-range check vs. low-level check |
Matrix interference | Sample composition affected one method more than another | Colored wastewater affecting photometric testing |
Reporting difference | Results used different units or chemical basis | NH₃ vs. NH₃-N; PO₄ vs. P |
Only after these checks should the laboratory conclude that one result is wrong.
11. Different Results Are Not Always a Problem — But They Must Be Understood
In routine water testing, the goal is not simply to force all results to be identical. The goal is to understand why results differ and whether the difference matters for the decision being made.
A field test may be correct for immediate process adjustment. A laboratory test may be correct for controlled reporting. A photometric method may be correct for routine monitoring.
A more advanced laboratory method may be required for trace-level compliance testing.
Each result has a context. Problems occur when users compare numbers without comparing the full testing conditions behind those numbers.
This is especially important for water quality parameters that are sensitive, unstable, matrix-dependent, or method-dependent.
Conclusion
When two water test results are different, the first question should not be: “Which instrument is wrong?”
A better question is: “Were the samples, methods, preparation steps, calibration conditions, and reporting units really the same?”
In water quality testing, a result is not only produced by an instrument. It is produced by a complete workflow: Sampling → preservation → preparation → calibration → measurement → quality control → reporting → interpretation
If any part of this workflow changes, the final result can change too. Two water test results can be different and still both be technically reasonable — because they may be answering different questions under different conditions.
For routine water analysis, reliable data does not come from the number alone. Reliable water quality data does not come from the instrument reading alone. It comes from a controlled testing workflow, including proper sampling, preservation, preparation, calibration, measurement, quality control, reporting, and interpretation.